Australia Vs 'The Big Short' - The Battle Of Mortgage Arrears
How does modern Australia compare to the era of 'NINJA Loans'
A big thank you to everyone who has subscribed and supported my work. We recently ticked over 2,500 subscribers. If you would like to join them in getting the Avid Commentator Report in your inbox, you can subscribe here.
Since the RBA started raising rates in May of last year, there has been a great deal of commentary on the “Mortgage Cliff” and the potential for defaults by Australian households. While I have serious concerns about how Australian households are going to cope with the challenge of higher rates in the long run, I have repeatedly counselled that the impact of higher rates was further away that many expected.
In August last year, I put together this thread on Twitter, detailing how years of low rates allowed over a third of variable rate mortgage holders to be completely immune to a 300 basis point rise in the cash rate. It also detailed how around 80% of fixed rate borrowers were immune to rate rises until at least Q1 2023.
Today, mortgage arrears are rising from a low base and a record proportion of borrowers are in mortgage stress, but its still very early days. To put it into a baseball analogy we are late in the 2nd inning or perhaps early in the 3rd.
In order to put the current circumstances into a historical perspective, we’ll be pitting it against the United States in 2006 at a similar point in the Federal Reserve’s pre-Global Financial Crisis hiking cycle.
The snapshot we’ll be using is July 2006.
It has been two years since the Federal Reserve began raising rates from an all time low level of just 1.0% at the end of June 2004. Over this period, the Federal Funds Rate rose by 4.25 percentage points to 5.25%.
This was an era where it was normal for over one third of all new mortgages to be written based on some form of adjustable rate. It was a major departure for a system that was generally overwhelmingly defined by long term 15 to 30 year fixed rate terms, with adjustable rate loans usually making up less than 10% of new mortgages.
At the same time the United States saw a proliferation of ‘Subprime Lending’, as some borrowers who likely never would have qualified for a mortgage previously were provided with loans, often with significantly higher than average mortgage rates or with a teaser rate period that would expire, leaving the borrower with a surge in repayments.
Perhaps the most absurd expression of this push was ‘NINJA loans’, where mortgages were given to borrowers who had ‘No Income, No Job and No Assets’. By March 2007, there were over 7.5 million subprime mortgages on a collectively debt of $1.3 trillion.
We all know how badly this ended and with the luxury of hindsight the warning signs are clear. But In July 2006, the perception of the U.S housing market in the mainstream collective consciousness was still quite positive and “house flipping” was still a popular past time.
Looking at some of the hard data at the time, this viewpoint was not unfounded. Between the start of the Fed’s hiking cycle in June 2004 and our snapshot in July 2006, mortgage delinquencies rose by 0.02 percentage points (1.60% vs 1.62%).
Despite the NINJA loans, the explosion in sub-prime lending and the general irresponsibility of the era, indicators such as mortgage delinquencies were still signalling the all clear. Even as late Q2 2007 mortgage delinquencies had only risen by 0.69 percentage points since the hiking cycle began and delinquencies were still below the level seen just prior to the recession following the Dot Com bust.
All Of This Has Happened Before…
Meanwhile in modern Australia there is a similar mood of relief to that of the U.S in 2006/2007, that so far higher rates haven’t led to much higher rates of mortgage arrears at the major banks. Considering the rise of ‘Extend And Pretend’ from lenders and the banking regulator this really isn’t too surprising, particularly when coupled with the sizable proportion of mortgage holders who either had a fixed rate until relatively recently or are so far ahead on their loan due to rate cuts over time that rate rises don’t impact them.
However, that doesn’t mean there are no signs of rising stress stemming from mortgage arrears data. According to an analysis from S&P Global Ratings which covers up until the end of June, mortgages 30+ days in arrears have risen across all state’s and territories compared with a year earlier.
The largest rise seen in the five most populous states has been seen in Victoria, with arrears rising from 0.94% to 1.5%. The smallest rise was seen in Western Australia, which saw a 0.12 percentage point rise (1.55% to 1.67%).
Its worth noting that overall arrears remain well in the ballpark of their long run average and in the case of the major banks, below the long term trend.
To put the broader issue of arrears into perspective its worth sharing this quote from a spokeswoman for non-bank lender Pepper Money:
“unlike many other lenders that exclude items from arrears such as hardship cases, Pepper Money’s reporting of arrears has no exclusions.”
This raises a fairly major question. To what degree are hardship provisions and other administrative categorizations of mortgages distorting arrears data?
For now a greater exploration of that question is perhaps best left for another day when we have a greater body of evidence to call upon.
And All Of This Will Happen Again…
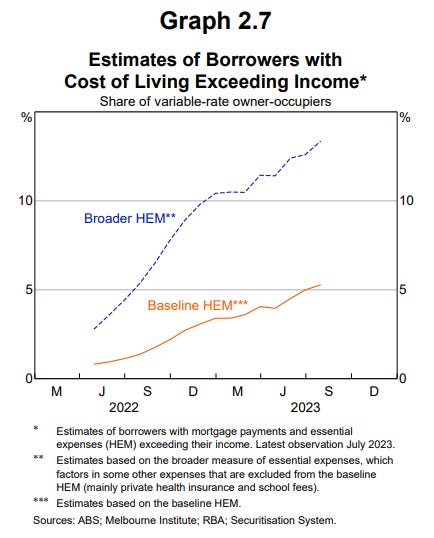
According to a recent analysis from the RBA a little over 5% of borrowers have a cost of living that exceeds their income. This is not based on actual cashflow, but instead based on the Melbourne Institutes Household Expenditure Measure or HEM.
The HEM assumes that a household has a median spend on the absolute basics such as food, utilities and transport costs, while having a level of discretionary spending in the 25th percentile (lower than 75% of all households).
Considering that a household in the 25th percentile for income had a gross income of $867 per week in 2021 ($45,084 per year), its quite swiftly clear how the HEM does not accurately capture the household expenditure for the overwhelming majority of mortgage holders.
In their analysis, the RBA included a second scenario which it called ‘Broader HEM’ in which other expenses (mainly private health insurance and school fees) were added to the calculation. In that scenario 13% of borrowers had insufficient income to cover their cost of living.
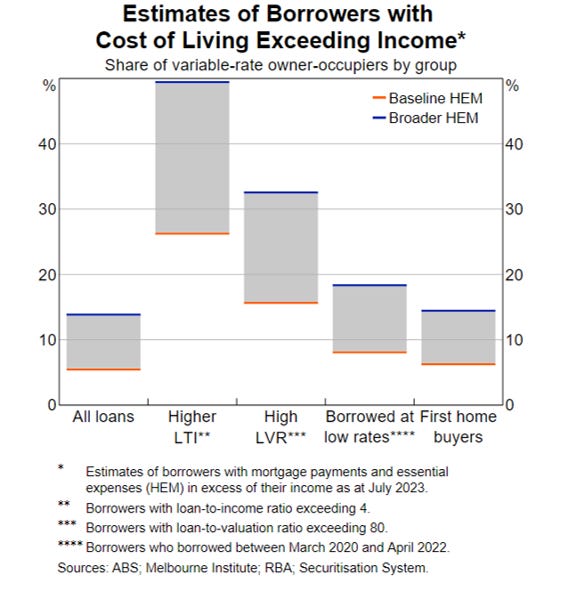
But where things really start to get interesting is the RBA’s granular analysis into high loan to income and high loan to value ratio variable rate owner occupier borrowers. While its still based on the HEM and broader HEM scenario, it illustrates nicely the level of risk for these the most exposed of borrowers.
For borrowers with a loan greater than 4 times their gross household income, ~26% of borrowers had expenses that exceeded their income based on the baseline HEM and ~49% based on the broader HEM.
For borrowers with a loan to value ratio exceeding 80% (less than 20% equity in their home), ~15% had expenses that exceeded the baseline HEM and ~32% based on the broader HEM metric.
Considering that this analysis is based on a what is likely a significant underestimate of the expenditure and other debt servicing requirements of mortgage holders, it suggests its only a matter of time before more mortgage holders find themselves in trouble.
It’s But A Matter Of Time….It Always Was
As I stated back on Twitter in August last year, it was always going to take a long while for this to all play out. Unlike past instances of swiftly rising rates, mortgage holders were given almost 11 years of ever lower rates to get ahead on their loans and a historically unprecedented proportion of households were insulated by long term fixed rate loans, the majority of which only began expiring in recent months.
While the United States in 2006 and Australia have different settings, in net terms when everything is balanced out, they aren’t too dissimilar. Despite rates rising over a protracted period and a high proportion of households exposed to variable rates, and expiring cheap mortgages, both have seen mortgage arrears remain near the longer term trend.
On the other side of the coin both have a high proportion of overleveraged borrowers who have insufficient cashflow to continue to make mortgage repayments on a long term time horizon.
It all comes down to time and circumstance.
Ultimately, the longer the current business cycle continues and the longer rates stay high, the greater the risk is that more mortgage holders will find themselves in serious difficulty. The current extremely high rate of labour force growth all but guarantees rising headline unemployment next year and the economy is already in a recession in per capita terms.
In time a global economic downturn may grant a reprieve in the form of lower rates, but that may prove to be little comfort if accompanied by Australia’s first ‘real recession’ in almost 35 years.
— If you would like to help support my work by making a one off contribution that would be much appreciated, you can do so via Paypal here or via Buy me a coffee.
If you would like to support my work on an ongoing basis, you can do so by subscribing to my Substack or via Paypal here
Regardless, thank you for your readership and have a good one.


Thank you for sharing this with us. I am not sure who else you read on Substack, have you seen this?
https://open.substack.com/pub/vitaliy/p/what-happens-in-china-may-not-stay?r=hhvbc&utm_medium=ios&utm_campaign=post
I'm guessing foreclosing on one's mortgage only happens as the very last resort, and certainly not whilst unemployment remains low . Hence agree that it is a slow moving ship, but one that is no doubt exhibiting signs of slowing, retail sales particularly.