
Australia's Economy Is Worse Than I Thought
Population composition changes is flattering an already poor result


When assessing the performance of the Australian economy, it can be a little bit like going down a rabbit hole, the deeper you go into the data and statistics, the closer you get to something approximating a more accurate read on things.
This journey begins at high level stats such as headline GDP, goes deeper past GDP per capita and generally eventually arrives at the most used proxy for Australian living standards, real household disposable income per capita.
On this metric, Australia’s performance has not been stellar in recent times.
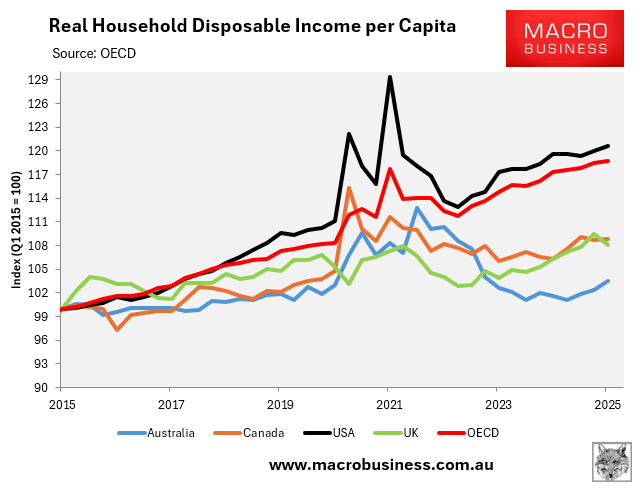
As the chart below from Macrobusiness illustrates, growth in real household disposable per capita in Australia has dramatically underperformed the OECD average, as well as the nation’s Anglosphere rivals.
While this is a major indictment of failure on the part of the nation’s collective policymaker class, there is actually another level of data deeper than this which better illustrates the actual level of the growth in living standards for households.
Part of the issue with real household disposable income per capita is it is just that, the total amount of household disposable income adjusted for inflation then divided by the total size of the population.
This doesn’t take into account the changes in the composition of the population over time.
For example, amidst higher levels of migration from working age adults and declining fertility rates, the proportion of the population made up by children has fallen significantly.
This should in a vacuum boost real household disposable income per capita in and of itself. After all, we are effectively on a grand scale taking children under the age of 15 and replacing them with working age adults.
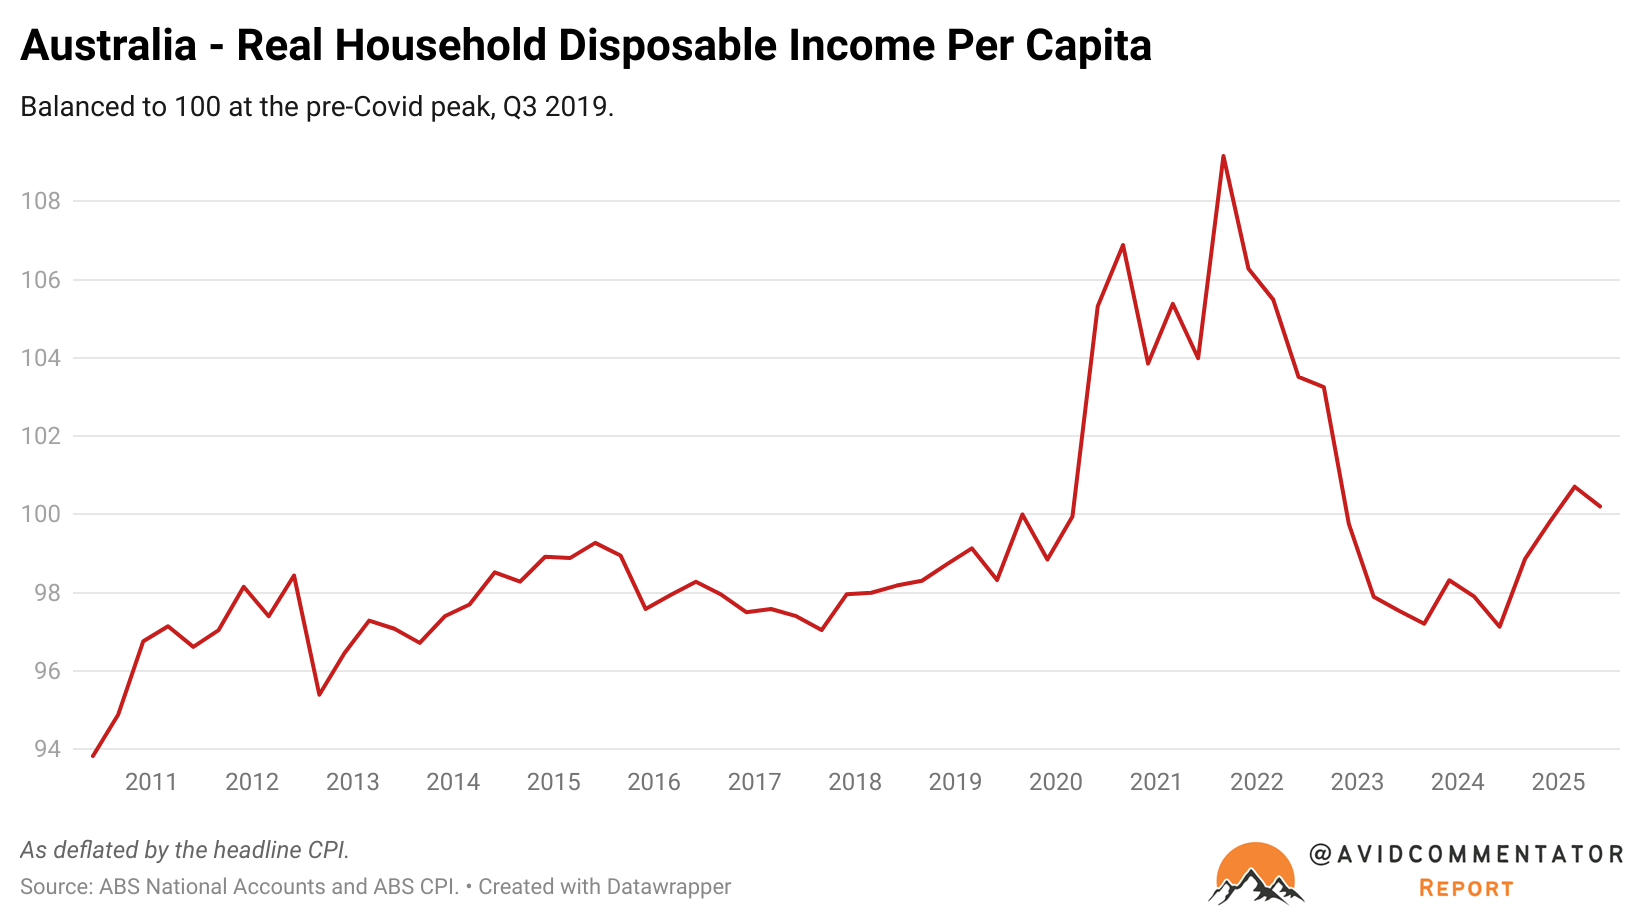
Yet despite this trend playing out over the last 15 years, real household disposable income per capita today is not dramatically higher than where it was in mid-2012.
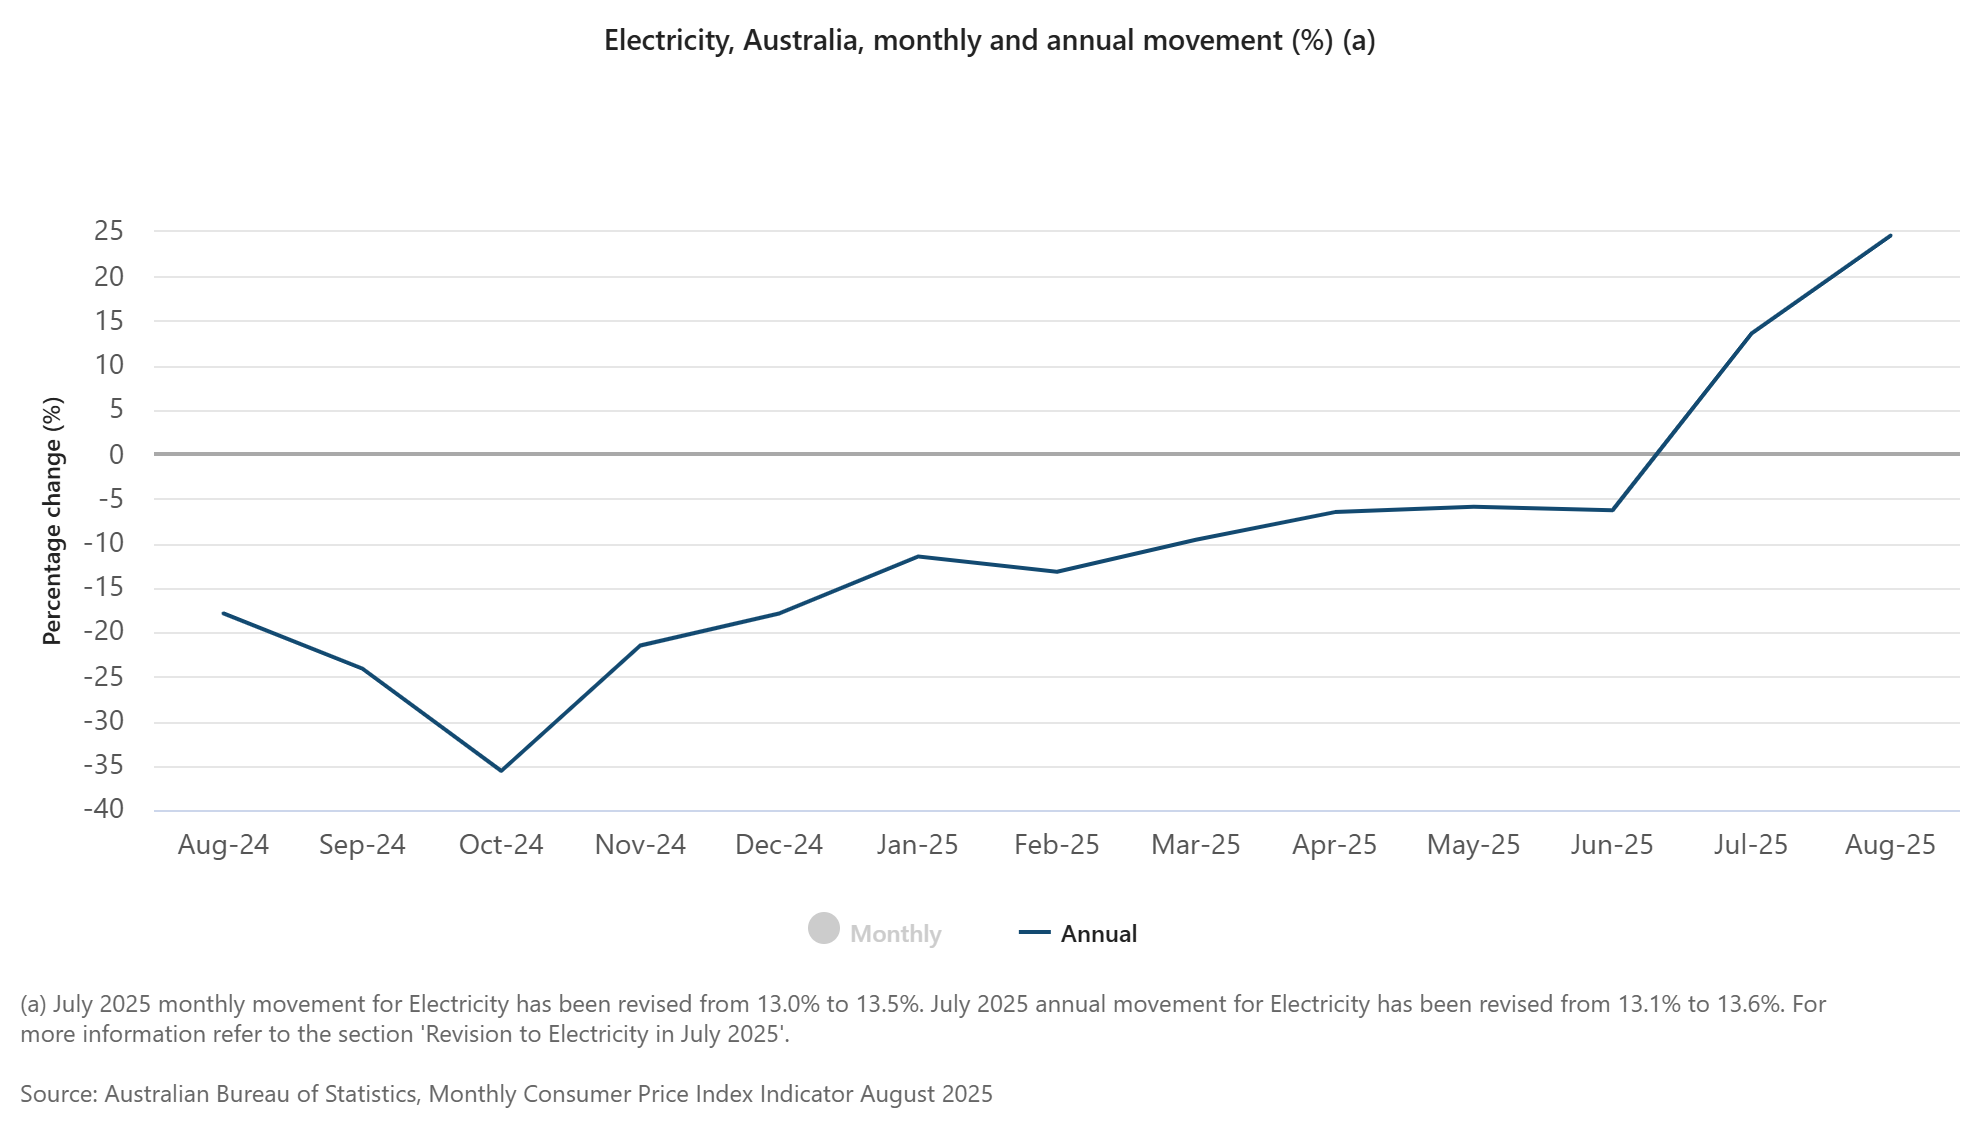
It’s also worth noting that part of the recent improvement seen in real household disposable income per capita has been driven by the suppression of the electricity component of the CPI by various state and federal subsidies.
With this now gradually reversing (which post dates the latest real household disposable income per capita data), we will see downward pressure on the growth of living standards, with the possibility of growth flat out reversing well within the realm of possibility.
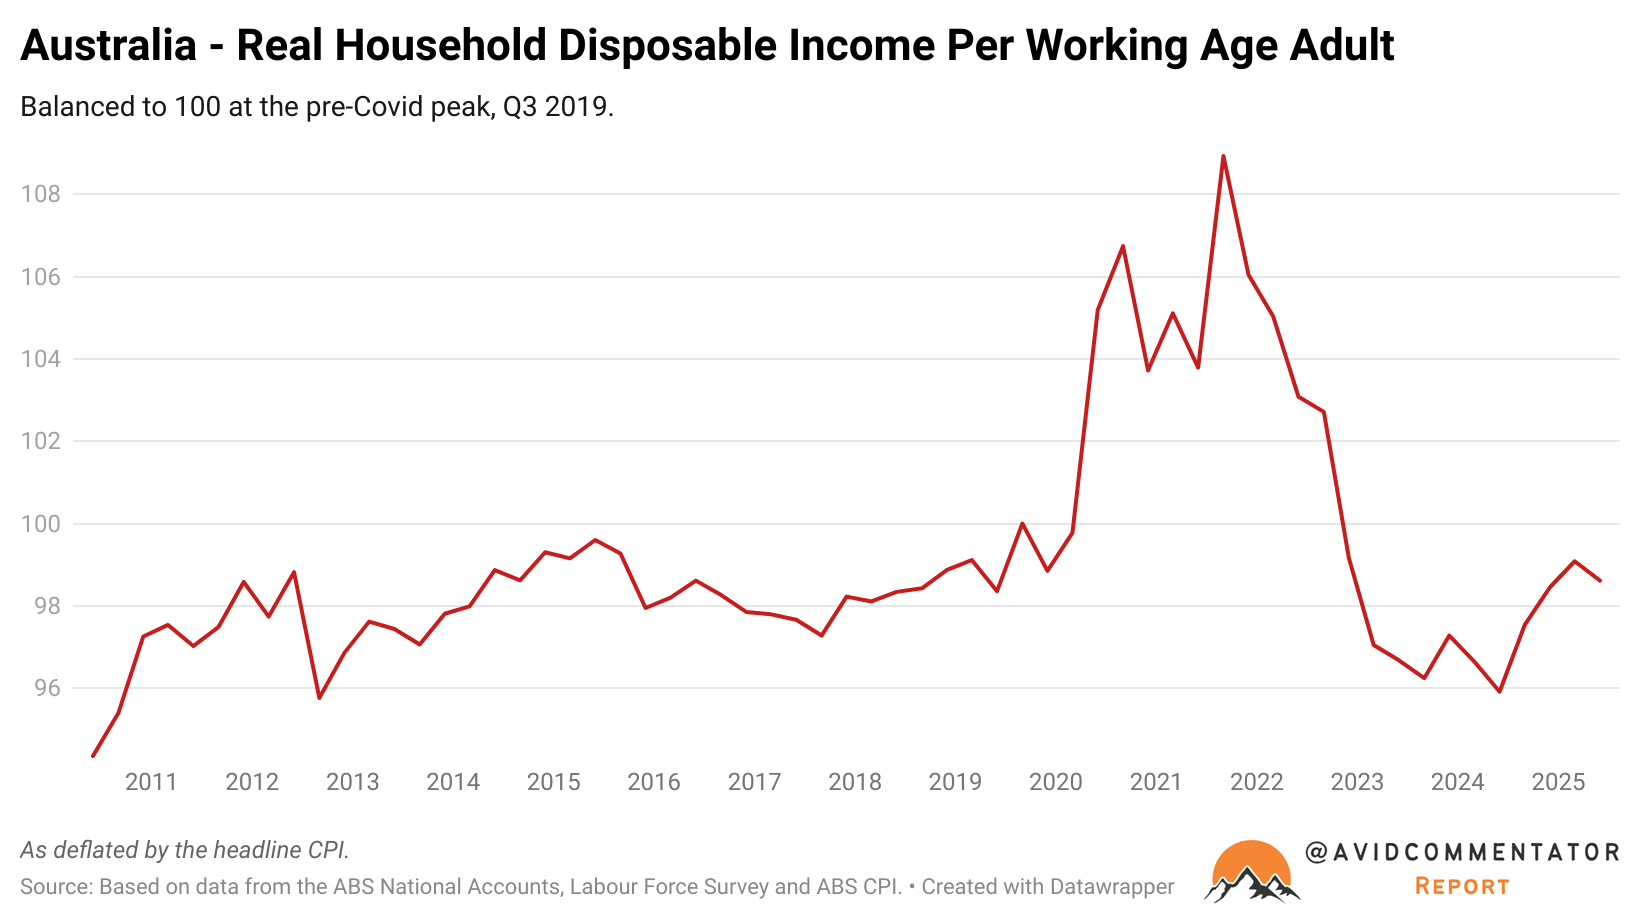
Anyway, back to the search for a more accurate barometer of living standards. Instead focusing on what real household disposable income growth looks like when divided by the working age population rather than the entire population.
As you can see from the chart below, on this metric there has been less than zero collective growth since the June quarter of 2012, 13 years ago.
Keep reading with a 7-day free trial
Subscribe to Burnout Economics to keep reading this post and get 7 days of free access to the full post archives.