
Australia's Fertility Rate Falls Below Japan Crisis Levels
A data driven deep dive


There is no paywall on this article.
Please feel free to share it far and wide, with friends, family and policymakers.
Many moons ago, way back in April 2013, SBS’s Dateline produced a special report entitled:
The Impact of Japan’s Declining Birthrate
It explored the impact of a declining fertility rate on Japan’s demographics, it’s economy and it’s culture.
The segment concluded with some brief commentary from a Japanese cafe owner in an area where demographics had already turned heavily toward an elderly population:
“This situation cannot continue. We know this very well.
The government or the state knows this as much as we do.”
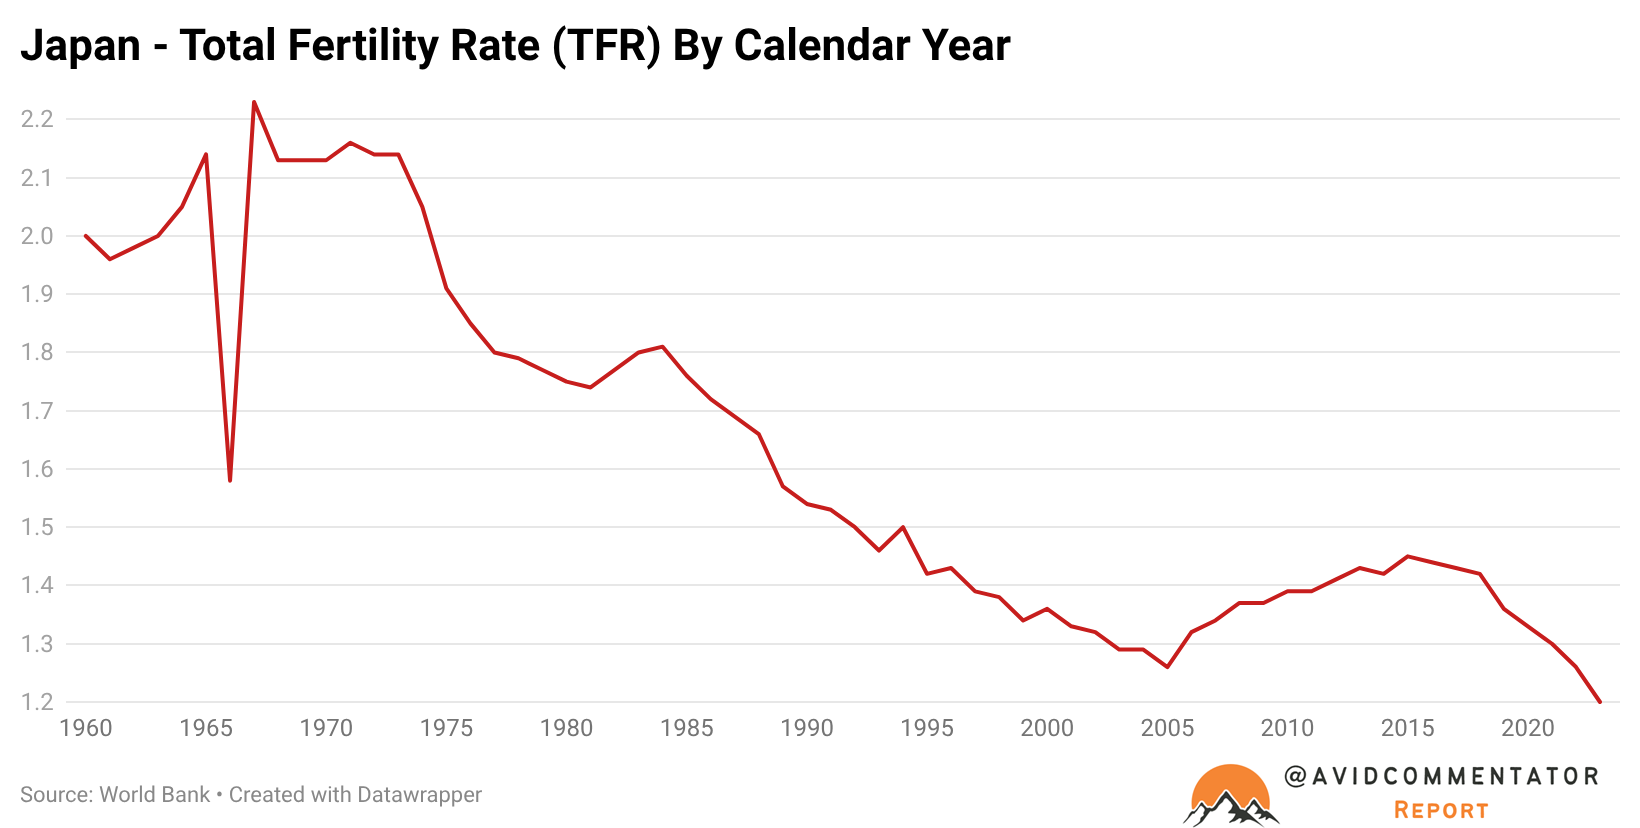
In the year that SBS produced this report, Japan’s total fertility rate or TFR was 1.43 babies per woman.
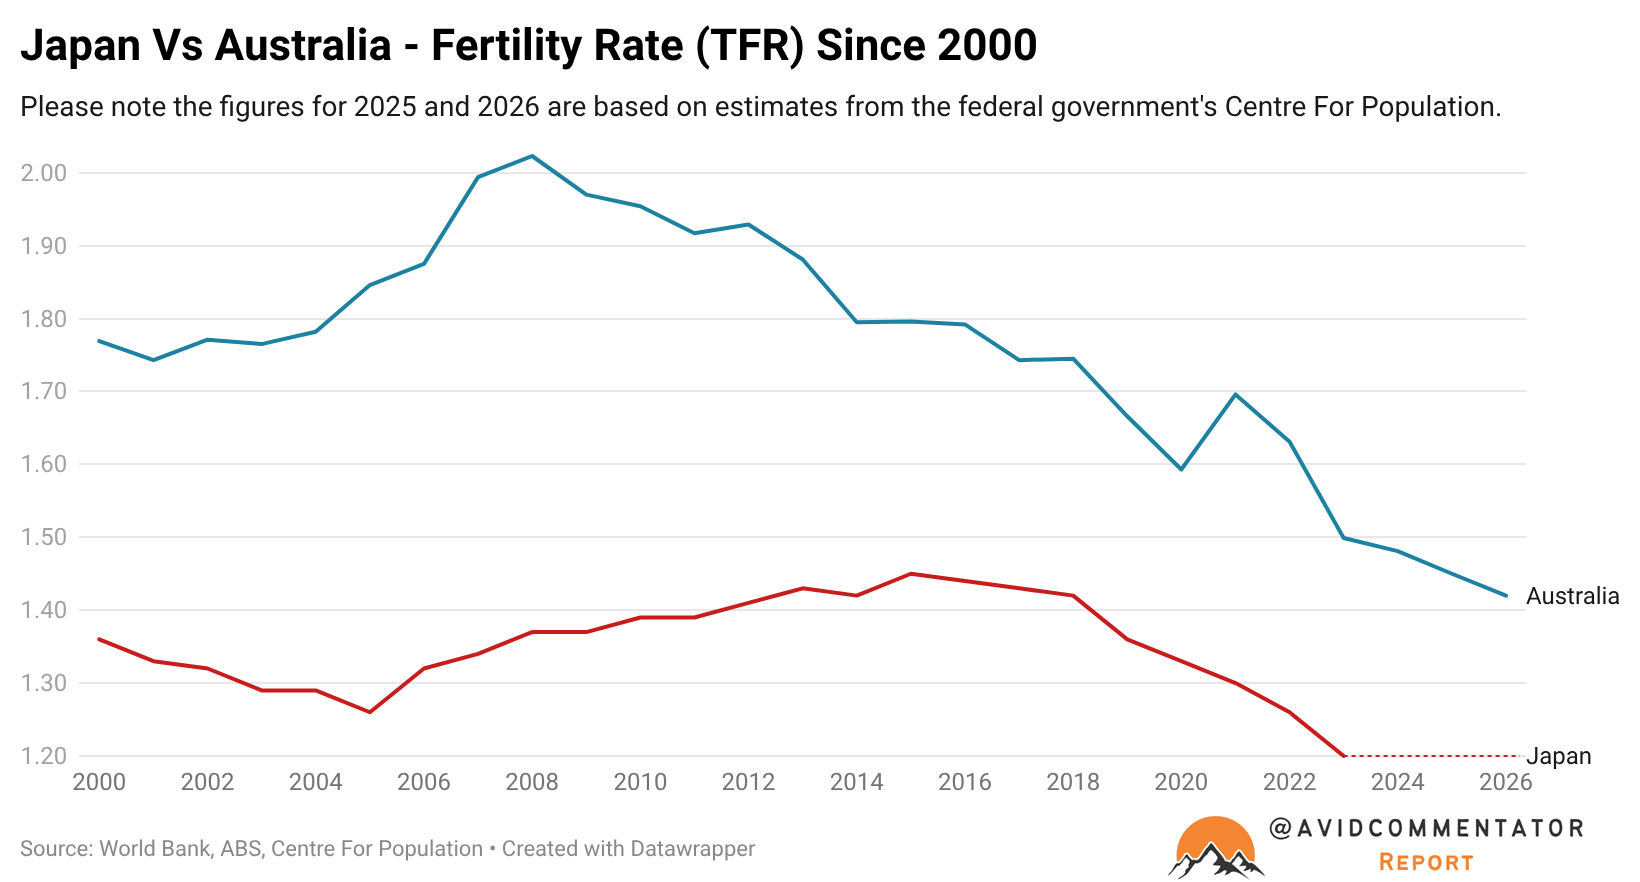
According to recent estimates from the federal government’s Centre For Population, Australia’s fertility rate for 2026 will be 1.42.
The deterioration in Australia’s fertility rate in the post-GFC era has been swift, at least from a long term demographic perspective.
In 2008, Australia’s fertility rate recorded its post 1970s peak of 2.023.
Since then it has all very much gone wrong.
Looking at various economic indicators, it’s rather obvious as to why, despite the rather dumbfounded approach of some policymakers.
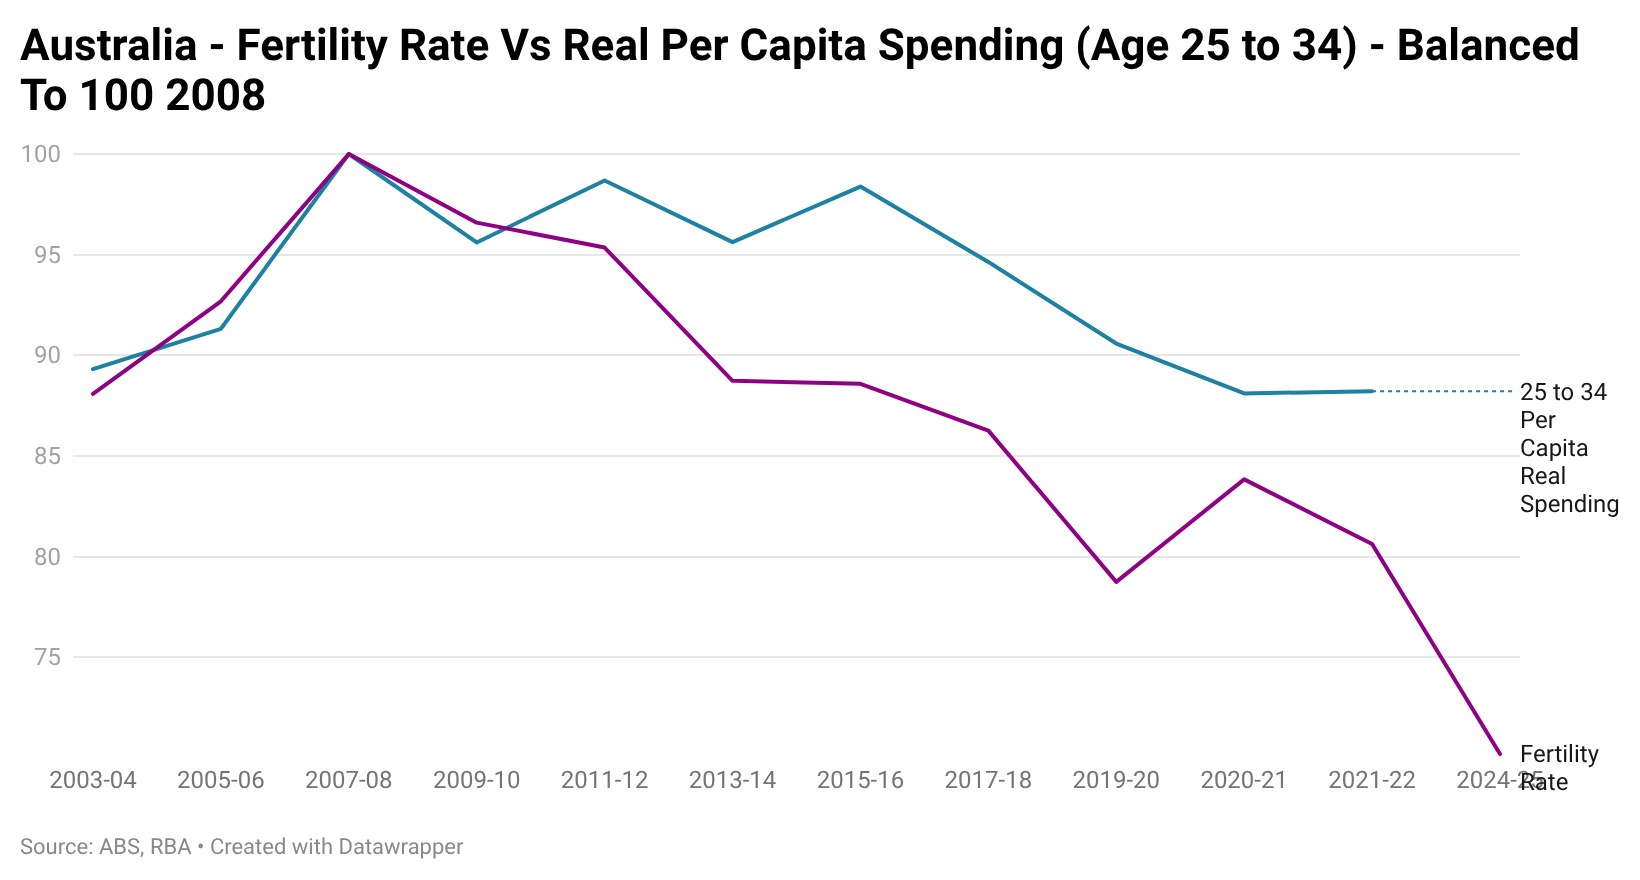
While 2008 marked the high point for fertility rates, it was also the peak for real per capita household spending for Australians aged 25 to 34.
Despite more than 17 years passing since this high watermark, it has not only never been eclipsed but gone backwards quite heavily.
As the chart below illustrates fertility rates rose with the means of per capita spending and then it fell with them.
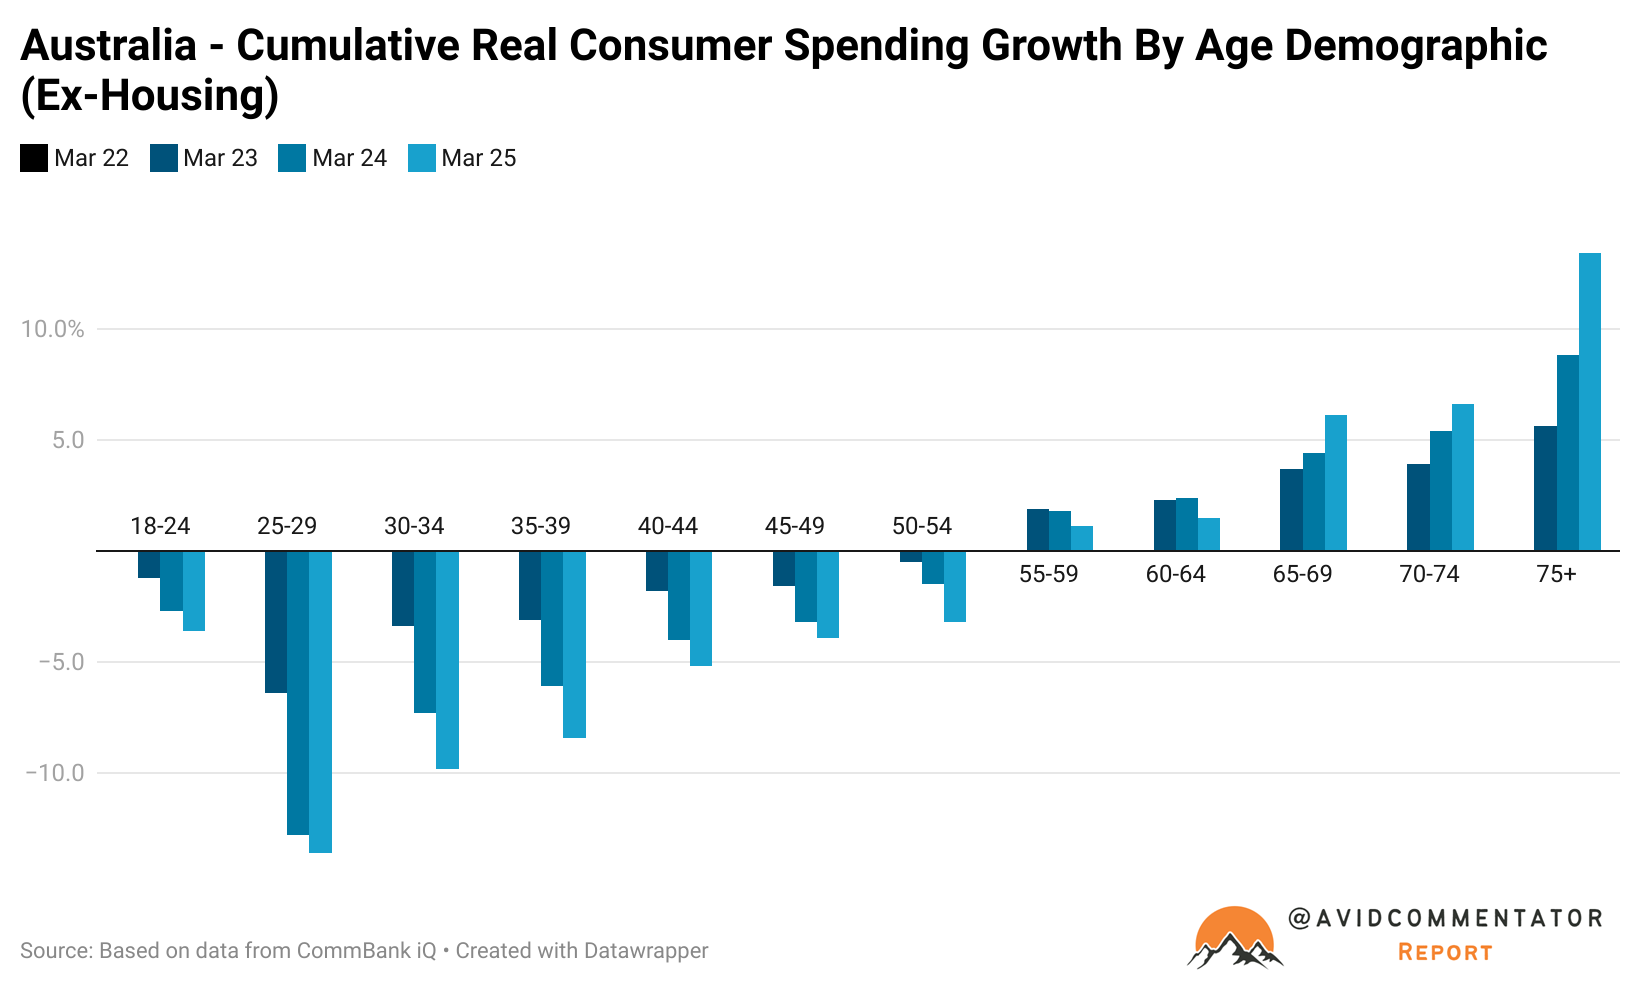
While this data set ends in June 2022, the data set on real household spending excluding housing from CommBank iQ picks up where the ABS left off, admittedly with a different methodology.
It reveals that the real spending of 25 to 29 year old’s underwent a technical depression between March 2022 and March 2025, falling by over 13%.
30 to 34 year old’s fared better, but not by a huge amount, with their spending down over 9%.
I’m not overly fond of combining different data sets, but if we were to make a very rough estimate of the fall in real spending of 25 to 34 year olds since 2008, it would arguably be in the region of 20%.
When looking at things through this lens it’s hardly surprising that fertility rates fell by 0.21 percentage points between 2022 and 2025.
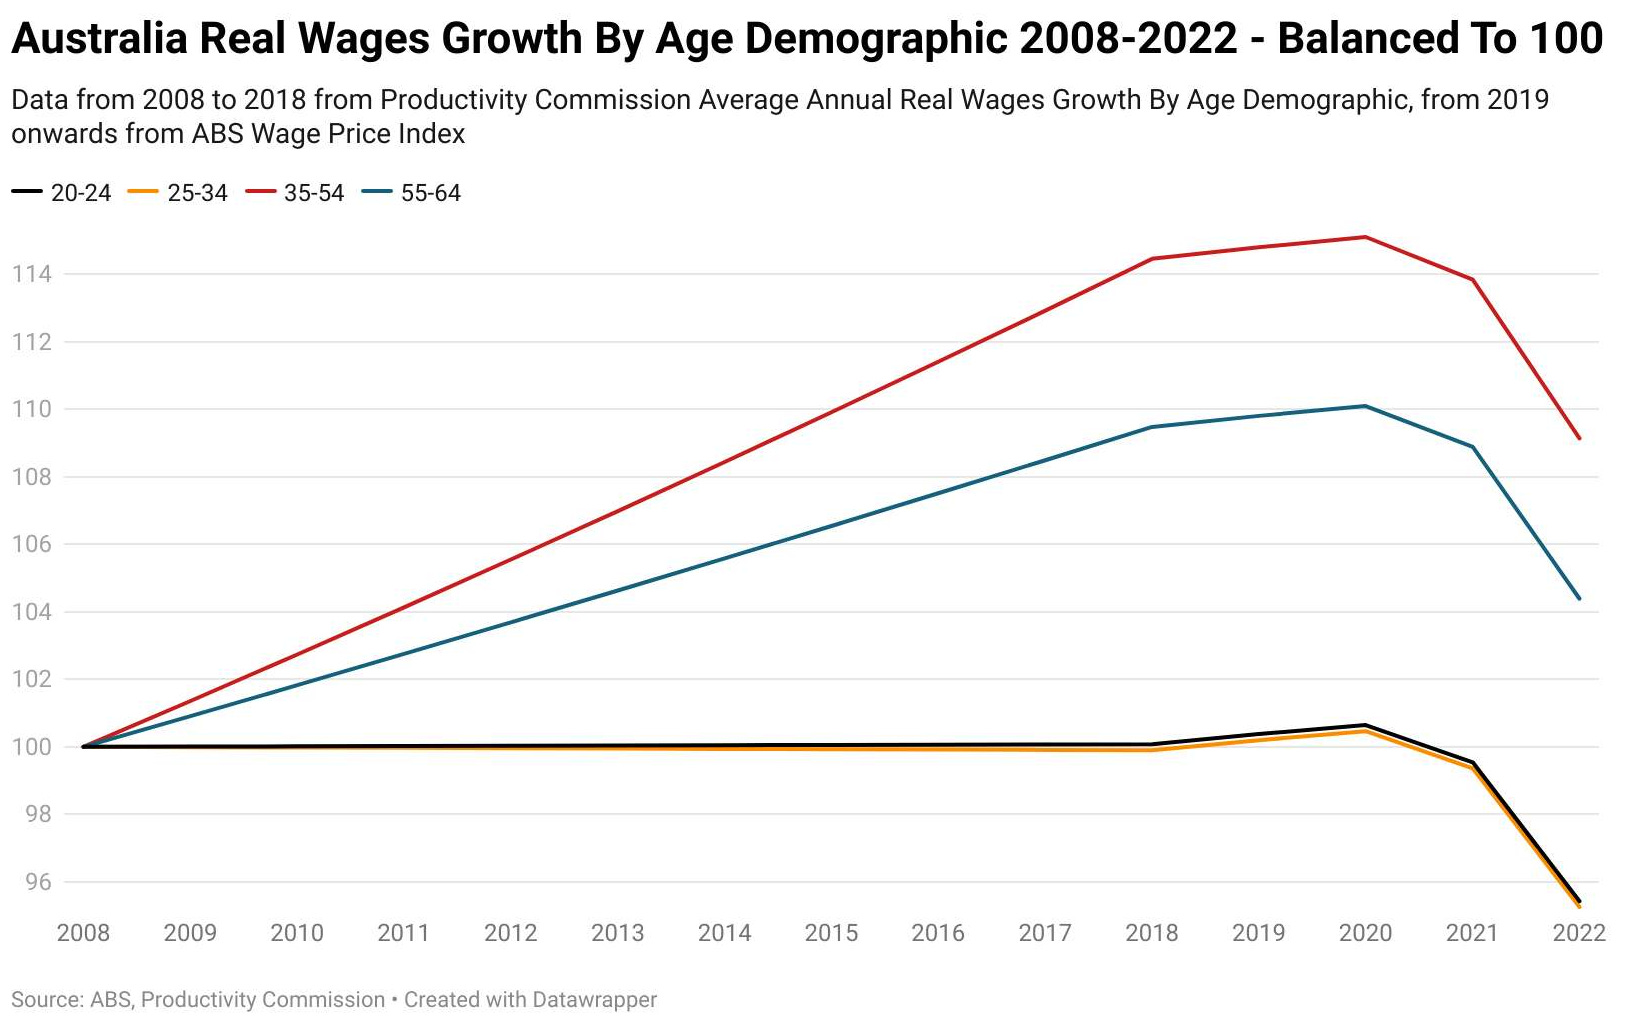
Meanwhile, real wages growth for 25 to 34 year old’s more or less flatlined between 2008 and 2018, resulting in whatever meager gains that were on offer being eaten up by taxes through bracket creep and then some.
Naturally, household spending and income is only one lens with which to look through this complex and multifaceted issue.
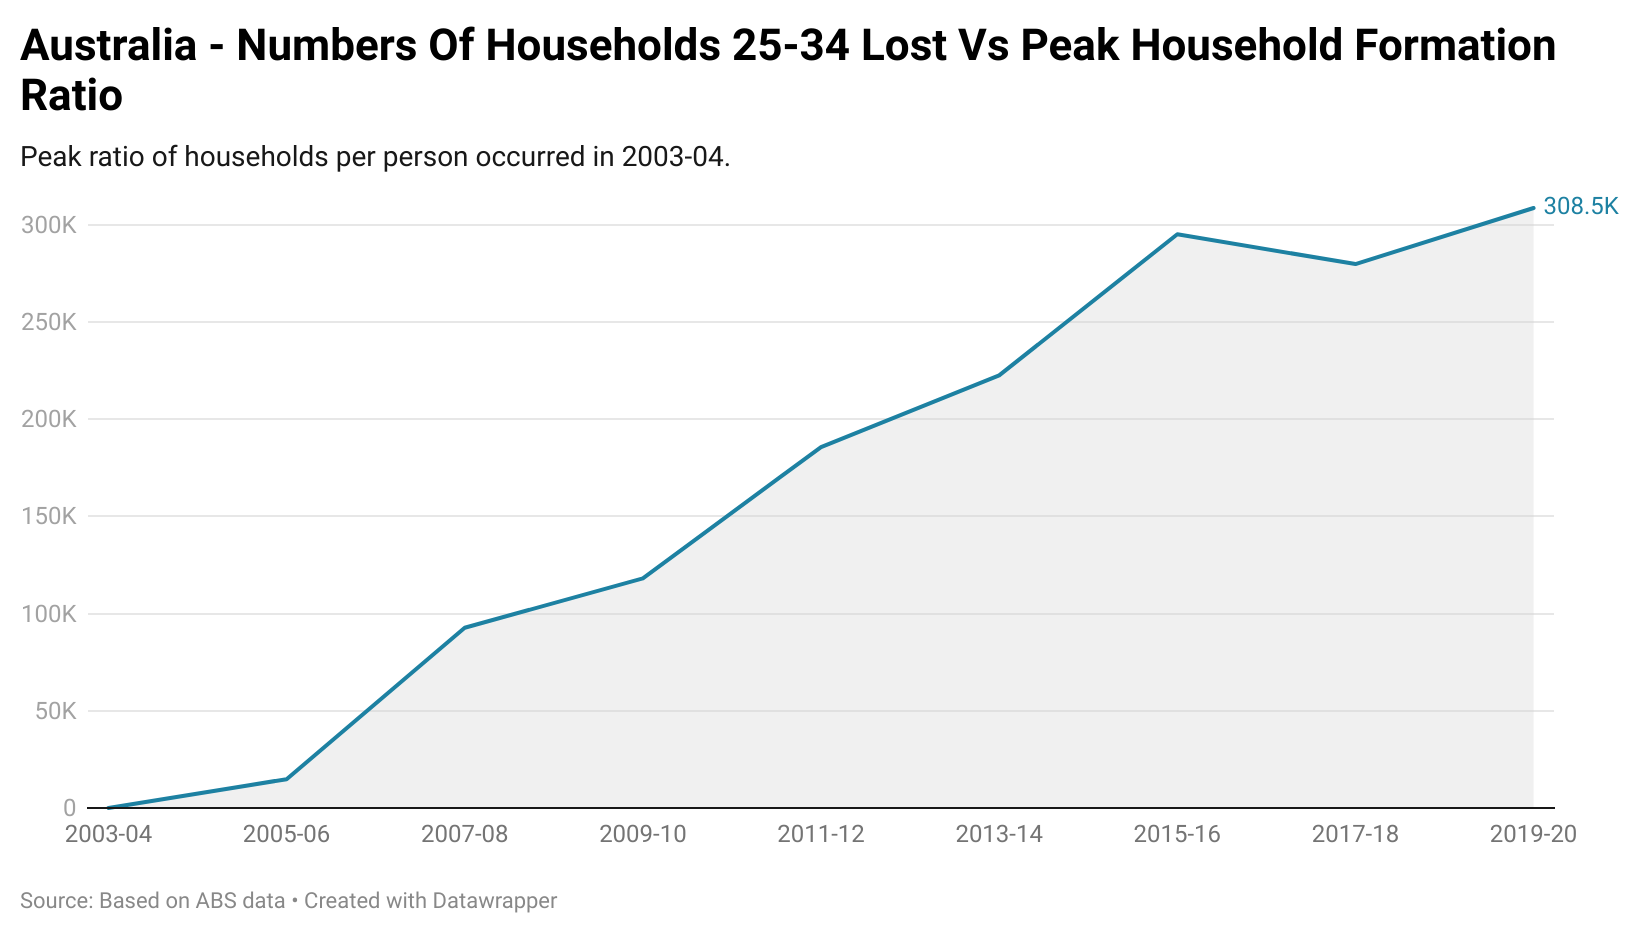
There is also the lagged impact of falling levels of households per capita in the 25 to 34 age demographic.
In a previous analysis linked here, I explored how the ratio of households to people in the 25 to 34 cohort has fallen.
2003-04 marked the high point for household formation in this age demographic and it has continued to deteriorate since.
In short, there are over 300,000 households in this demographic who would have come into being had the peak ratios been maintained, but the simply haven’t.
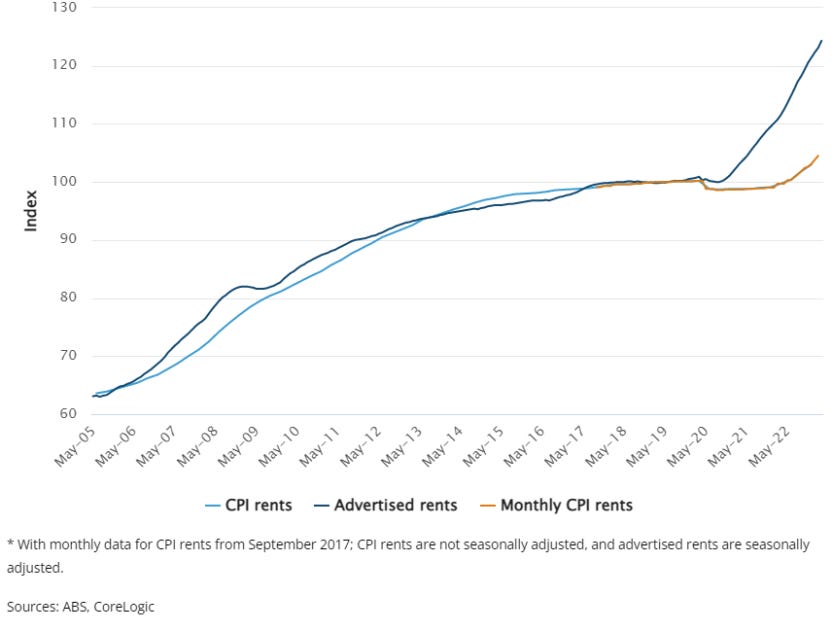
As illustrated by the chart below from the ABS, this era saw a surge in rents as vacancy rates fell dramatically amidst the first impact of the big Australia migration intake came at the same time as younger Australian households were at their peak formation rates.
According to the Corelogic Housing Affordability Report, produced late last year, the affordability of homes has deteriorated dramatically over the last 25 years.
At the start of their data set in the September quarter of 2001, a mortgage on the median house nationally assuming a 20% deposit consumed 23.6% of the median household income.
Today it takes 48.7% of the median household to afford the median home, despite the fact that the last quarter of a century has seen the further rise of the dual income full time working household.
In terms of price to income ratios, the median house nationally cost 4.4 times the median household income.
Which is roughly where the U.S home price to income ratio is today, which is ringing alarm bells.
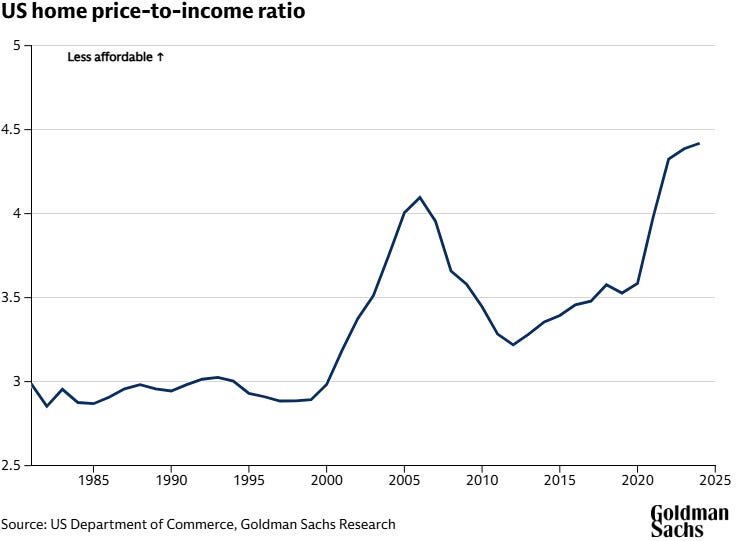
Today, the median house nationally costs 8.9 times the median household income, putting into perspective how divergent Australia’s housing affordability outcomes have become compared with some of our peers.
The Takeaway
While this is naturally a complex issue, the data clearly illustrates that the fortunes of the vital 25 to 34 demographic have deteriorated dramatically.
From falling real household spending outcomes to a more doubling of the cost of servicing a mortgage a quarter of a century ago, creating favourable conditions to have children has got quantifiably harder.
But unlike Japan, which has placed a heavy but ultimately failed emphasis on fertility rates, Australia’s policymakers continue to persist under a set of priorities that it’s seemingly not that big of a deal.
The simple reality is that beginning to undo the damage of the fortunes of Australians in the vital childbearing age demographics is going to be a challenging process, particularly due to the fact that there are vested interests and millions of Australians who have built their success on the very same settings that have delivered us to today’s circumstances.
Ultimately, the right choice is obvious, Australia’s future children and their parents should be our priority and the consequences of that accepted as the cost of social cohesion and national survival.
— If you would like to help support my work by making a one off donation that would be much appreciated, you can do so via Paypal here or via Buy me a coffee.

If you would like to support my work on an ongoing basis, you can do so by subscribing to my Substack or via Paypal here
Thank you for your readership.
One doesn’t need a spreadsheet to see the generational divide: our current tax and welfare systems consistently prioritise the wealthy and elderly at the expense of the young and the working poor.
The discrepancy in how we apply means testing is staggering. Support for those under 55 is governed by stringent criteria and narrow windows of eligibility. Conversely, reaching a certain age unlocks a suite of financial perks—many of which are either not means-tested at all or benefit from generous loopholes. For instance, according to National Seniors Australia, certain assets like the family home are often excluded from calculations, allowing couples in multi-million dollar residences with significant savings (over $1m) and large income (over $110k) to still claim a part Age Pension.
The contrast is starkest when comparing household support. A wealthy retiree might access heavily subsidised aged care regardless of their millions in assets, yet a young family of five—earning significantly less per person and struggling without a home or savings—can find themselves disqualified from basic Family Tax Benefits or even simple community supports like children’s sport vouchers.
While the younger generation is taxed heavily to fund the system, the wealthiest cohorts enjoy extensive tax concessions on superannuation and investments. We have built a system where those with the least are asked to contribute the most, while those with the most are shielded by policy.
A very interesting article.
One thing I’ve noticed amongst many friends and colleagues- you no couples work and save like demons to try have a shot at buying a house - which is really quite hard.
Suddenly you’re in your late 30s/early 40s and ready to have a kid - and then biology works against you and it’s extremely hard to have a kid.
So you consider IVF - which has no guarantees and is also ludicrously expensive.
So even if you manage to get in a position to have housing security that makes having children more appealing, you’re hit with more disincentives due to the staggering cost of fertility treatment.