
Australia's Per Capita Depression


Recently I hit over 40,000 followers over on Twitter, so to celebrate we are running the first ever sale on subscriptions to Burnout Economics.
From Saturday the 24th till the end of January, all subscriptions will be 20%.
A big thank you to all of you have subscribed or followed me on Twitter, it is very much appreciated.
Onwards to more great long form content in 2026.
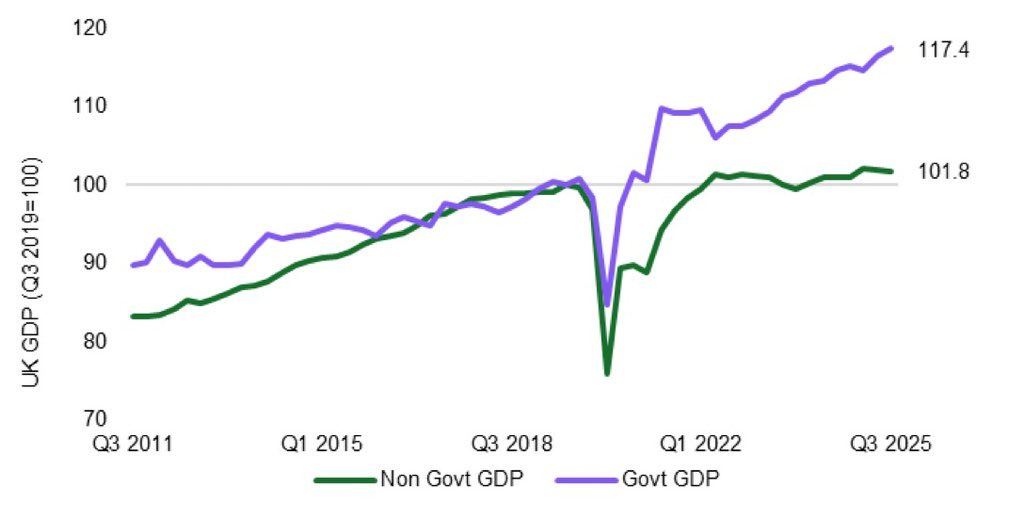
Recently the chart below contrasting growth in Britain’s government funded GDP and non-government funded GDP went viral on social media.
It illustrated quite nicely how non-government GDP growth had been anaemic since the start of the pandemic, while government GDP had grown dramatically.
This left me with a question, what would Australia’s path look like if charted in the same way.
To that end, today will be something of a deep dive into this and go into a much greater level of granular detail, including:
Government vs non-government GDP growth over time
Growth in government vs non-government GDP in per capita terms (as deflated by ABS)
Growth in government vs non-government GDP in per capita terms (as deflated by headline consumer price index)
Growth in different elements of government, day to day spending vs investment in relative terms
We will also being doing something a bit different to the usual analysis of the national accounts from this perspective.
While there will be the traditional numbers based on how the ABS adjusts each component of the national accounts for inflation (various components have different inflation deflators), I will also be taking the numbers that are unadjusted for inflation and instead deflate them by the headline CPI.
Government Vs Non-Government
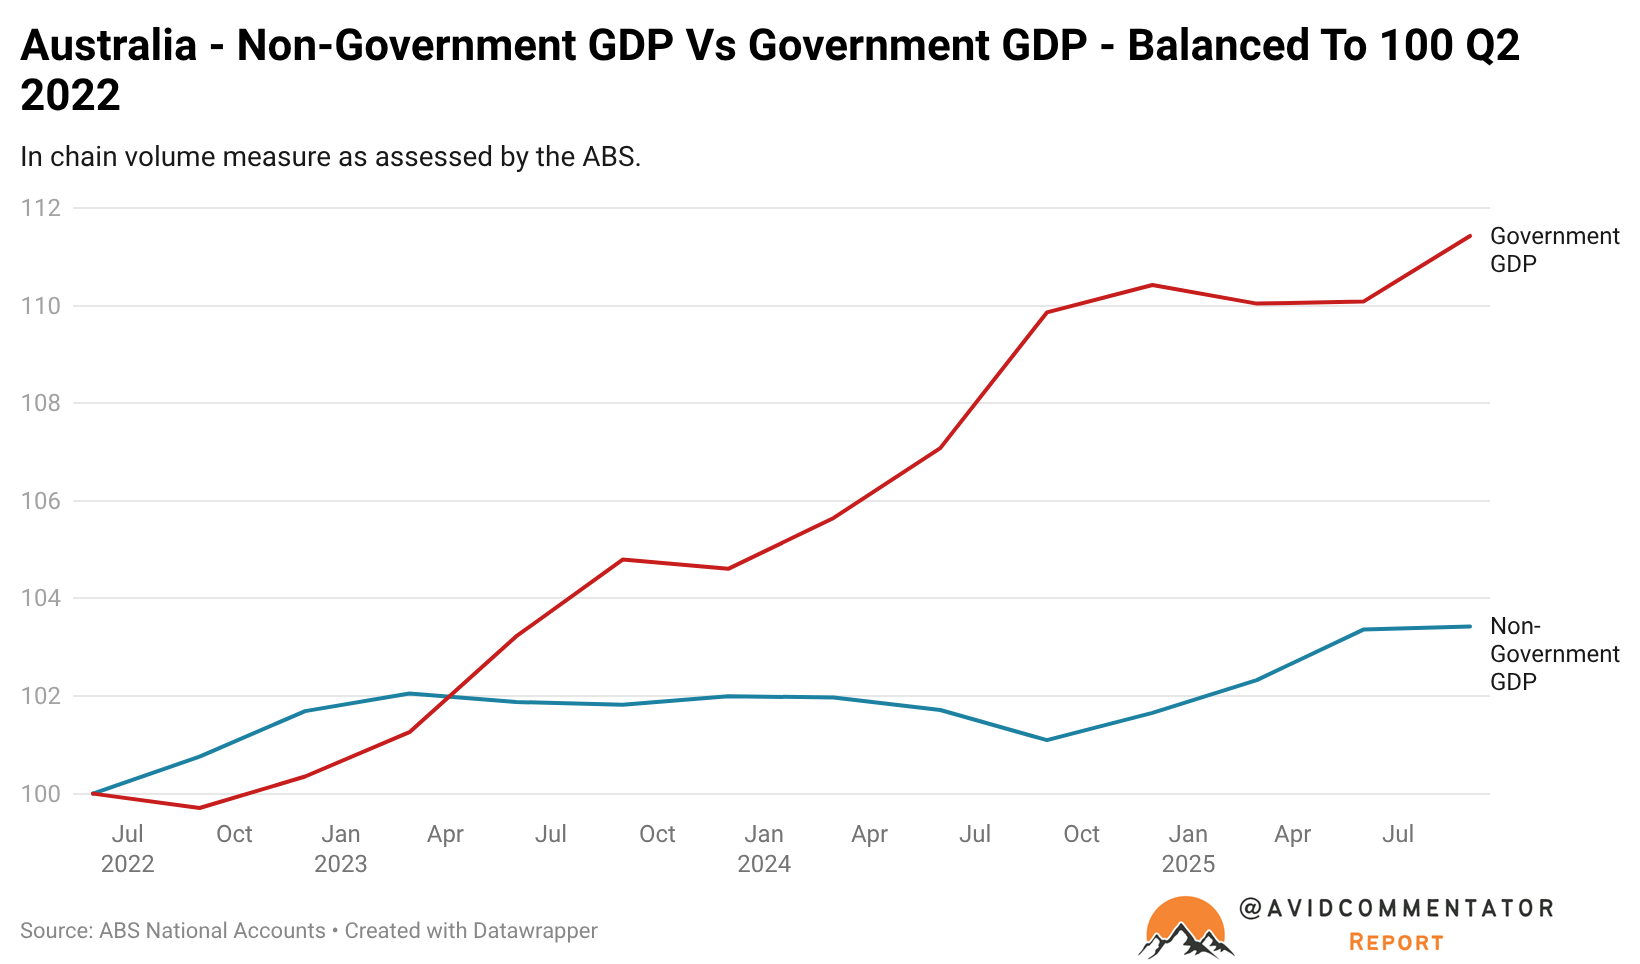
In order to get a handle on today’s key questions, we’ll be looking at the data based on two different timelines, one from the end of 2019 and another from Q2 2022.
Why Q2 2022?
While it marked the election of the Albanese government, from an economic perspective it also marked the end of robust growth in GDP per capita.
Since then 10 out of the last 13 quarters have recorded negative levels of growth in GDP per capita.
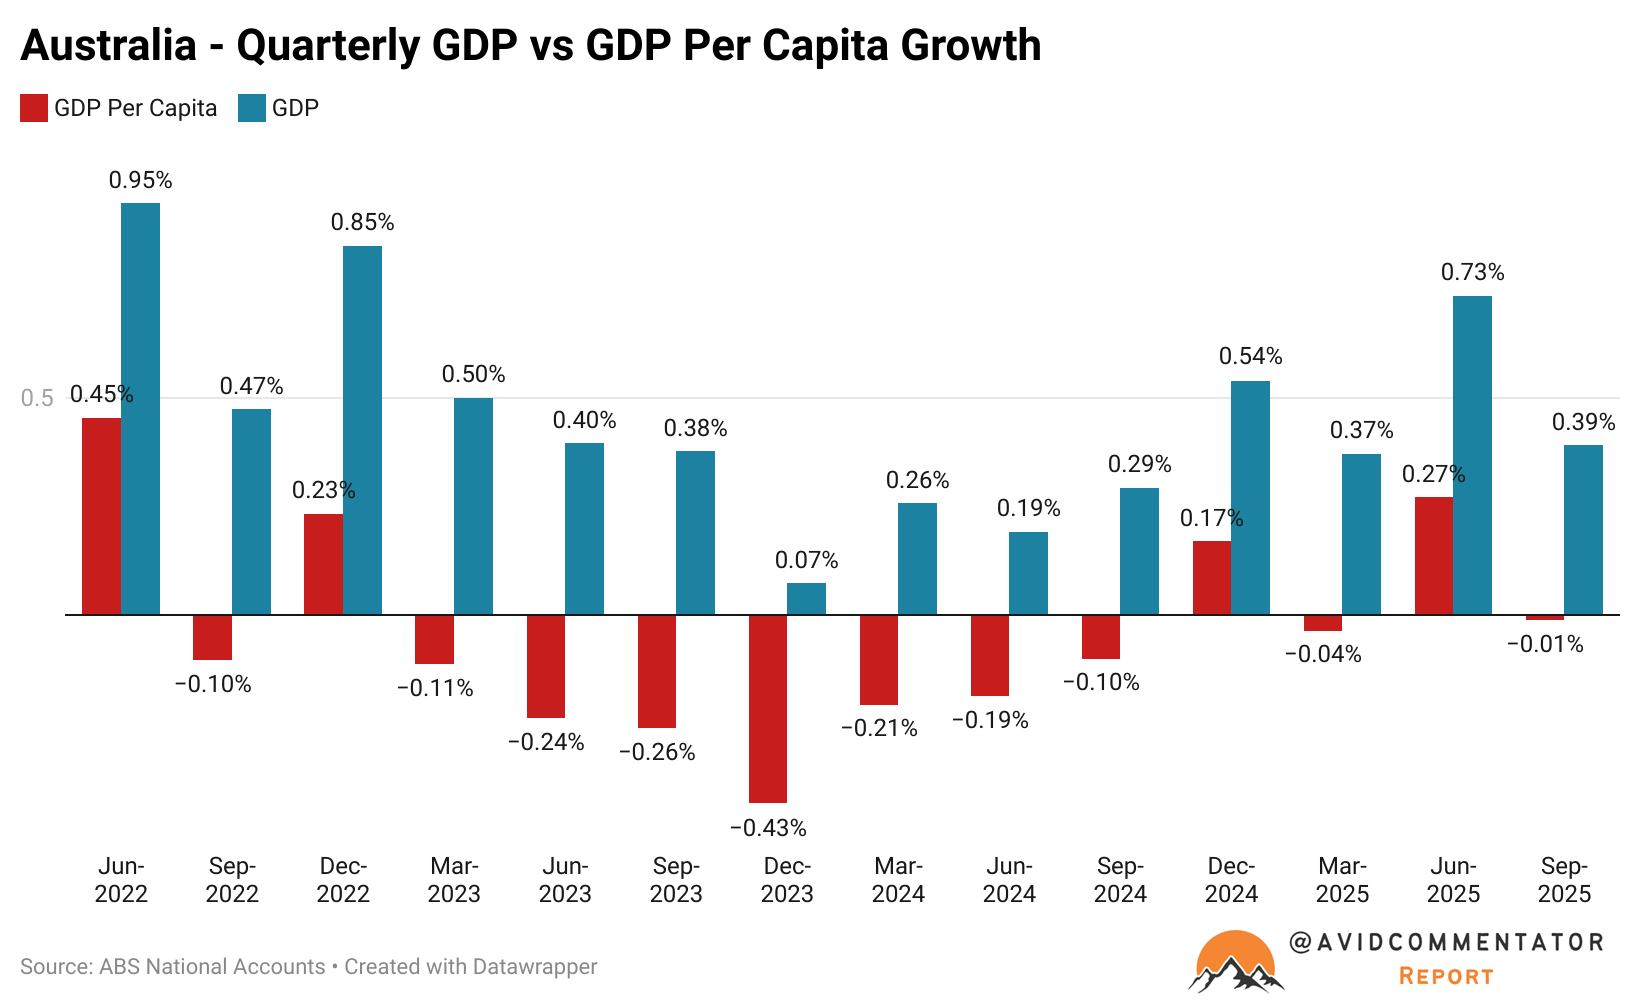
In terms of relative headline real growth since Q2 2022, government GDP has risen by 11.4%, while non-government GDP has risen by 3.4%.
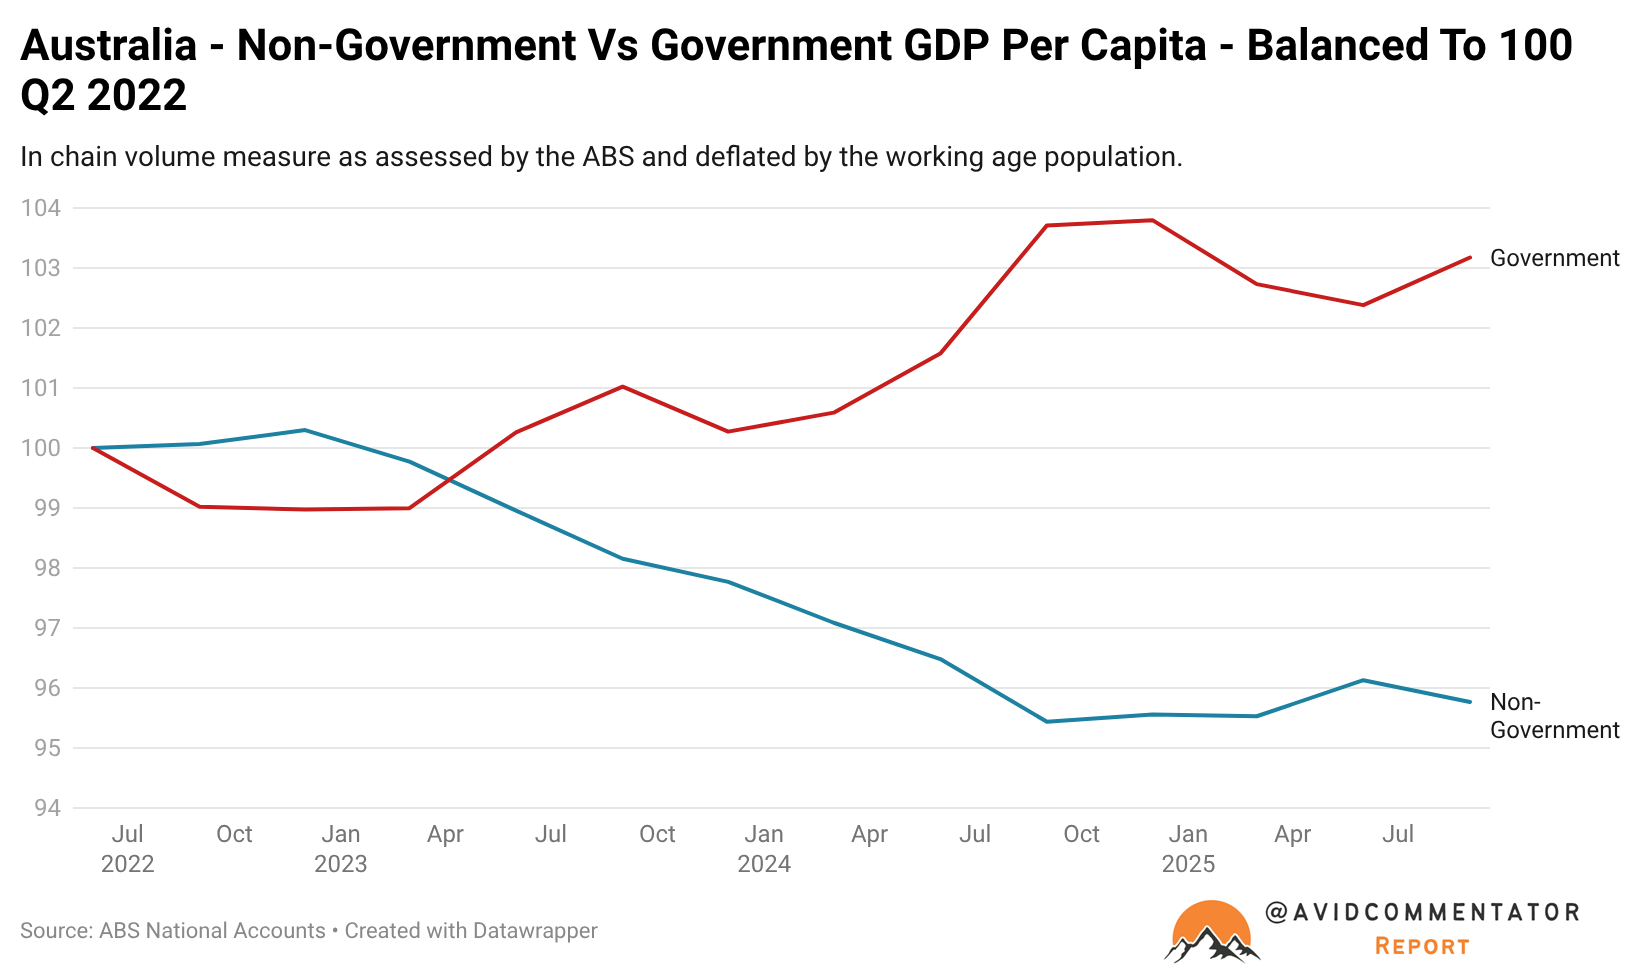
If we shift the focus to a per capita measure as deflated by the working age population, things swiftly become significantly less favourable.
Government GDP per capita has risen by 3.2%, compared with a fall of 4.2% for non-government GDP per capita.
It’s here that someone usually raises the point of the impact of pandemic driven stimulus and how it can distort the numbers.
So let’s take a step further back to when non-government GDP per capita actually peaked, Q2 2018 and then rerun the analysis from then instead.
Keep reading with a 7-day free trial
Subscribe to Burnout Economics to keep reading this post and get 7 days of free access to the full post archives.