
Is Big City Aussie Property Stalling?
Recent data shows price falls in Sydney and Melbourne.


In every year of post-pandemic data there is always a seasonal surge in housing auction clearance rates in Sydney and Melbourne.
As the chart below from SQM Research (which I and many others believe to be the absolute unchallenged gold standard for auction data) illustrates, every year the Sydney market in particular surges as the summer auction season kicks off following the hibernation of the property sector over the Christmas period.
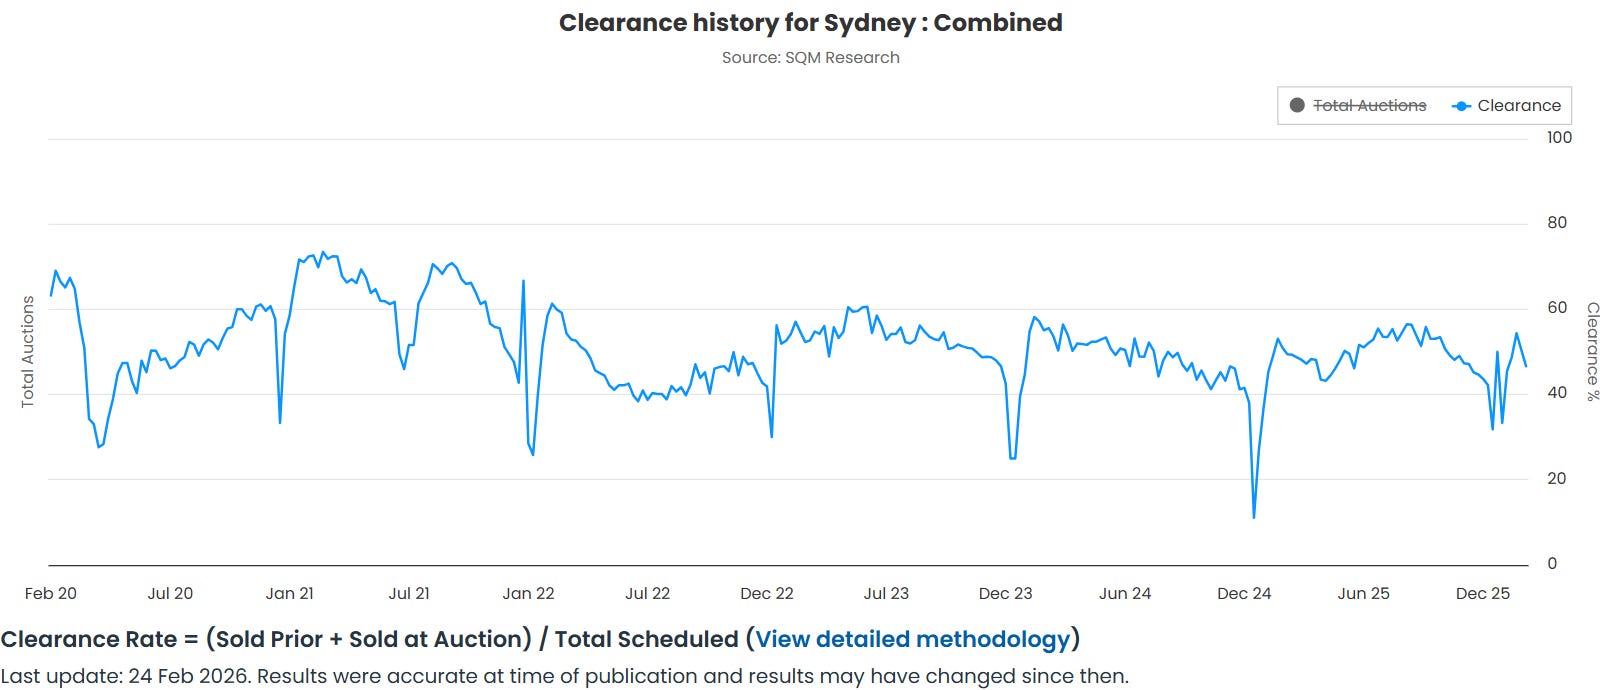
In the entirety of the post pandemic era, Sydney auction clearance rates have risen by an average of 7.7 percentage points between the 4 week average for the final weeks of the year unimpacted by the holiday season and the fourth auction weekend following Australia day.
It’s a similar story for Melbourne, with clearance rates rising by 8.1 percentage points on this metric.
But this year that hasn’t happened.
In Sydney, clearance rates are up by 1.5 percentage points compared with the aforementioned November/December period and up by 3.5 percentage points in Melbourne.
Looking at the statistics from a perspective of overall clearance rates rather than the relative change in trend, both Sydney and Melbourne are seeing significantly weaker results than last year.
Sydney is down by 4.3 percentage points from 50.9% in 2025 to 46.6% for the same time of year.
Melbourne on the other hand is down by 2.6 percentage points compared with last year’s total, 53.5% vs 56.1%.
This relative weakness is now manifesting in Cotality’s (former known as Corelogic) data, with Sydney and Melbourne seeing price growth dive into negative territory, despite the other major capitals still recording extremely high levels of price growth.
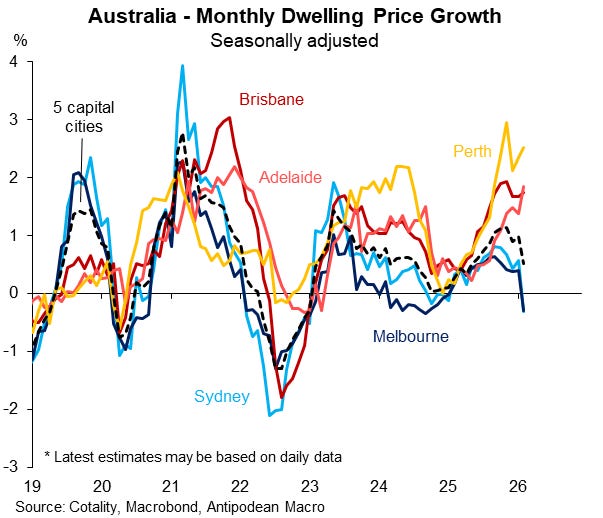
Source: Antipodean Macro
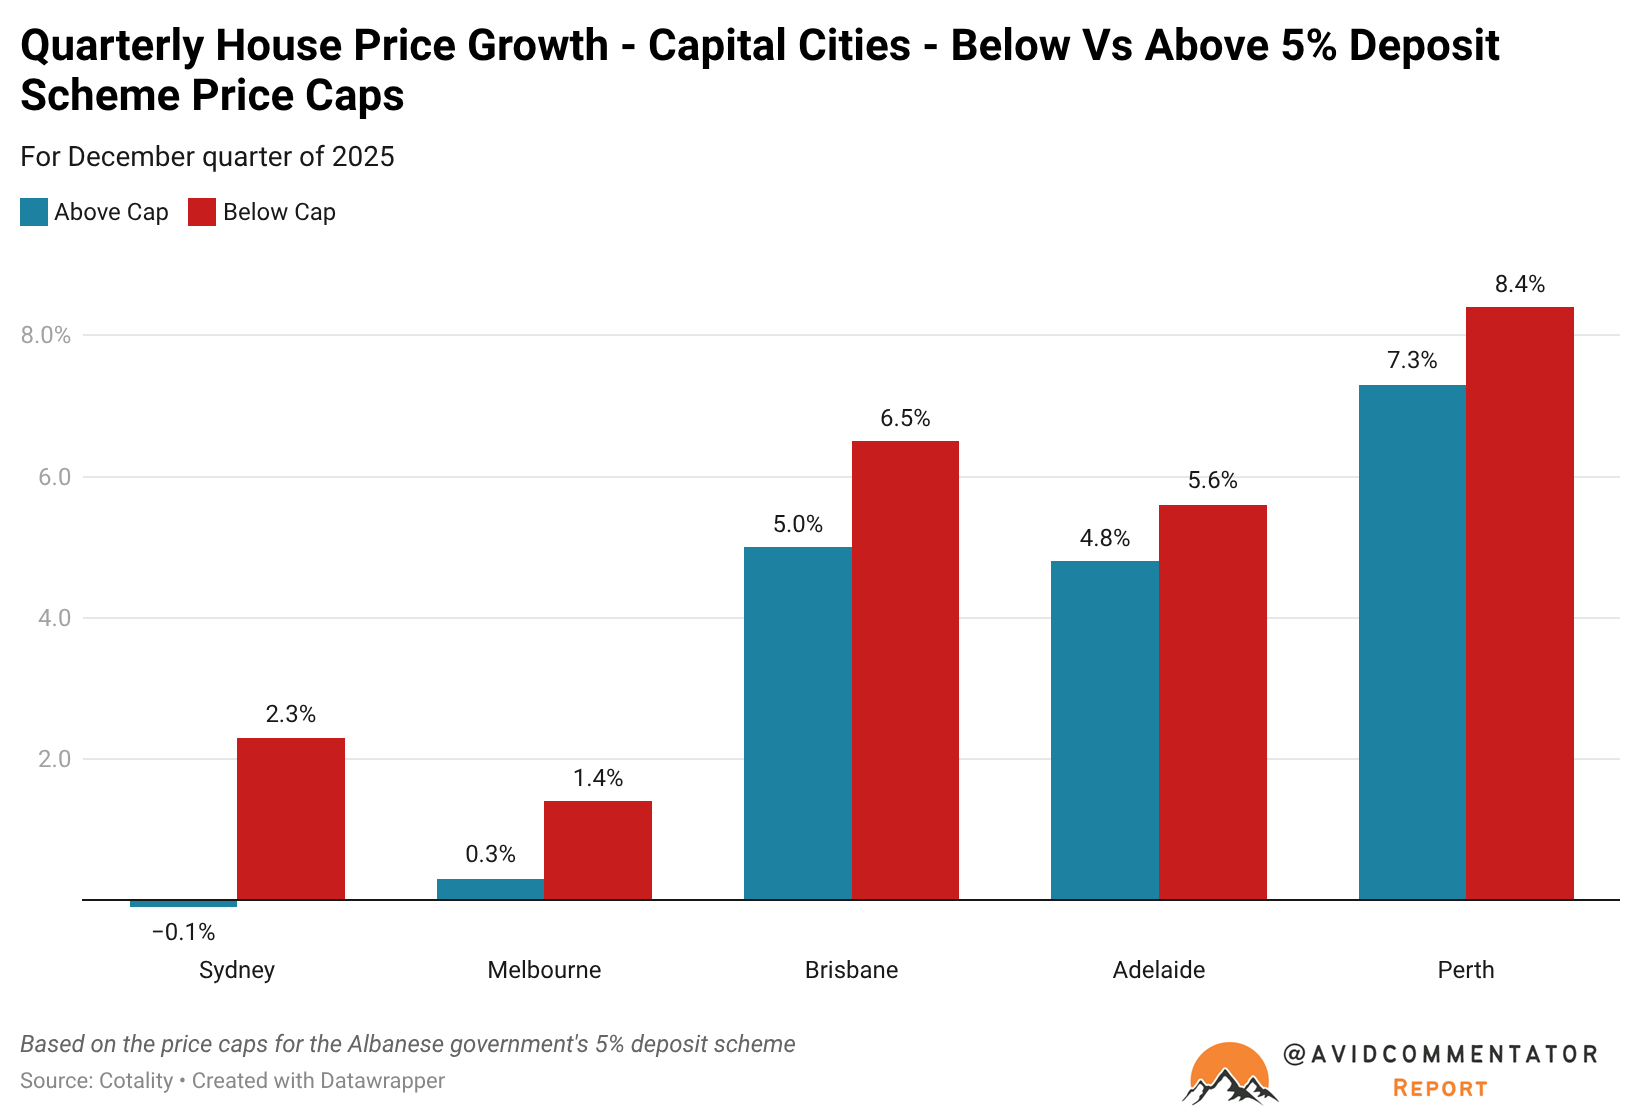
It’s worth noting that is what the picture looks like with the Albanese government’s 5% deposit scheme boosting outcomes in the segments of the market that are under the price caps, which for Sydney are $1.5 million and $950,000 for Melbourne.
According to an analysis from Cotality on the first full quarter of the scheme, price growth below the cap in Sydney was 2.3%, while above the price cap prices fell by 0.1%.
It was a somewhat similar story for Melbourne, with prices up by 1.4% in the range below the cap and up by a significantly lower 0.3% above the cap.
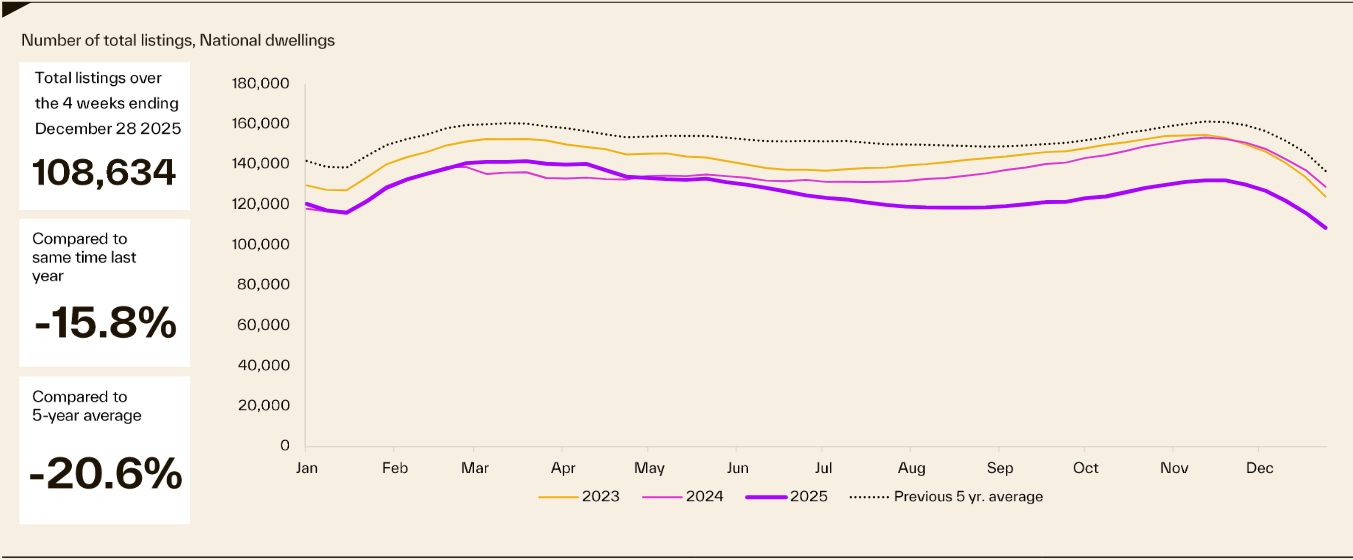
Part of the reason for this divergence in price outcomes between Sydney and Melbourne, and the other major capitals is the amount of stock coming to market.
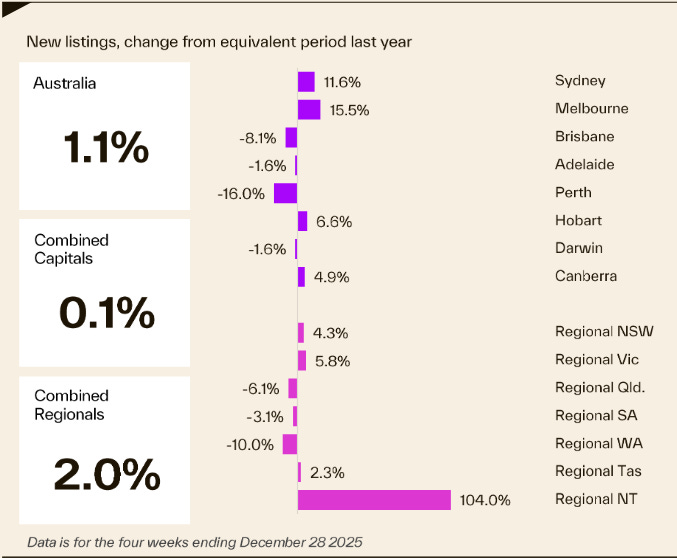
While overall listing volumes nationally remain deeply depressed even compared with the already historically low 5 year average, new listings are rising significantly more robustly in Sydney and Melbourne.
Source: Cotality
In Sydney, new listings are up by 11.6% compared with the same period last year, up by 15.5% in Melbourne, 4.9% in Canberra and 6.4% in Hobart.
Source: Cotality
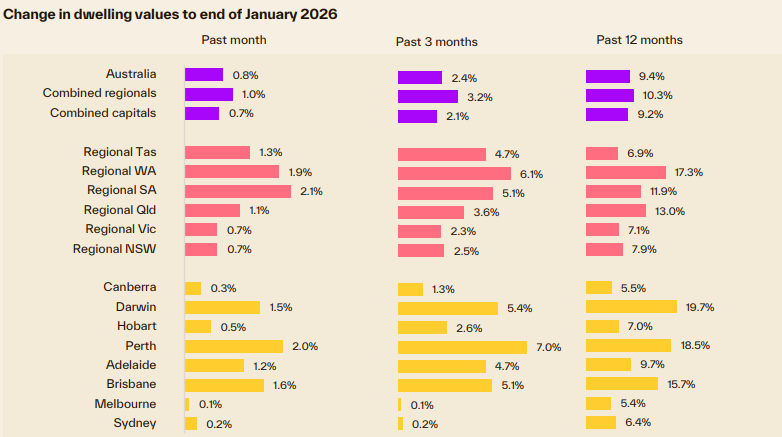
Looking at the latest month ended price growth data, each of the aforementioned capitals are underperforming the capital city and national average.
Source: Cotality
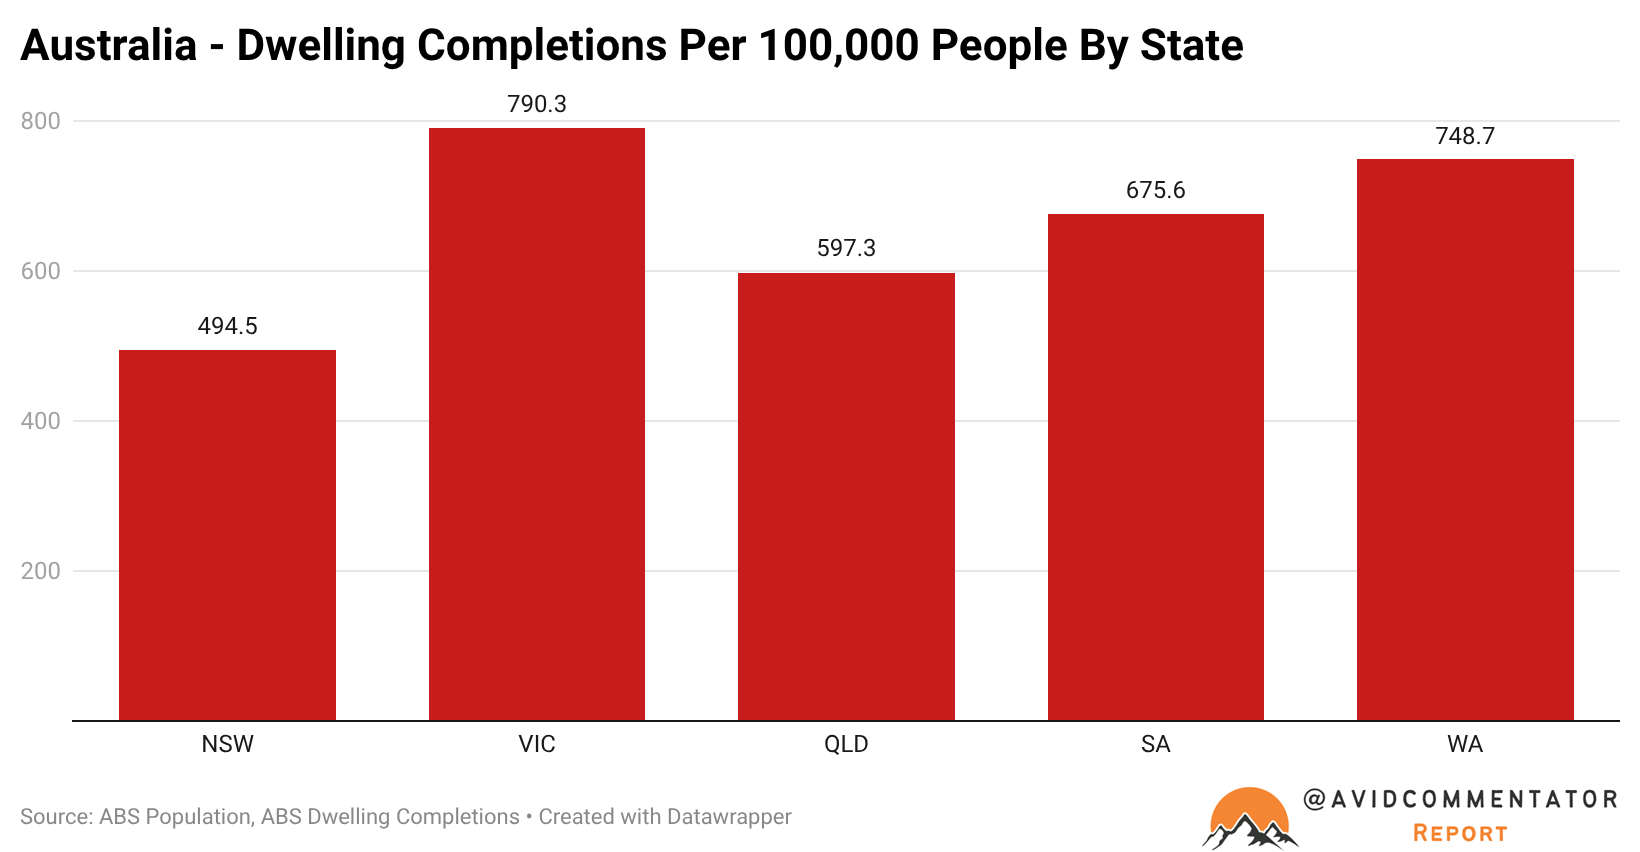
Meanwhile, Melbourne’s price growth also faces the headwind of the strongest per capita dwelling completions on a rolling 12 month basis of any major state.
The Takeaway
With affordability as stretched as has ever been in the history of some data set’s such as the Cotality Housing Affordability Report, which goes back to 2001, the growing headwinds may finally be taking the positive momentum out of the sails of the Sydney and Melbourne property markets.
It’s worth noting that the complete collapse in total listings on market has played a major role in amplifying and later facilitating price growth trends across much of the country.
Now that has started to reverse ever so slightly and without this tailwind at the market’s back in Sydney and Melbourne in particular, price growth has suffered.
If over time stock levels do continue to move toward normalization, this will become a more and more significant drag on these markets.
Another major factor going forward will be the role played by first home buyers, in particular those having their purchases facilitated by the Albanese government’s 5% deposit scheme.
As widely anticipated the schemes first months saw a dramatic surge in demand from this cohort, but the question is what sort of tempo can be maintained over a long term time horizon. As the ranks those with the means and the opportunity to buy the right home for their needs eventually dwindles back toward trend, as has been seen with other government interventions to boost demand.
Ultimately, it’s early days for property market outcomes in 2026, but there are signs that this may be a year of even greater divergence in price growth outcomes between the major capitals than we have already witnessed in recent years.
— If you would like to help support my work by making a one off donation that would be much appreciated, you can do so via Paypal here or via Buy me a coffee.

If you would like to support my work on an ongoing basis, you can do so by subscribing to my Substack or via Paypal here
Thank you for your readership.