Looking For Inflation In All The Wrong Places
Concerns about a wage spiral were greatly overblown.
Since inflation first surged back above the RBA’s 2-3% target band in 2021, there have been concerns that Australia could experience a wage price spiral, putting further upward pressure on inflation.
In reality, that didn’t come even close to coming to pass, with annual wages growth topping out at 4.3% in the December quarter of 2023, far below that of the United States or the U.K.
Yet even if Australian wages growth peaked well into the 5% range, it still wouldn’t have been even close to the main force driving real growth in aggregate demand, population growth.
In order to gain some perspective on the impact of wage growth on aggregate demand, we’ll be looking at data from July 2022 onwards, including exploring some scenarios on what things would look like if wages growth was significantly higher. This particular date was chosen as the starting point since the RBA began its tightening of monetary policy in Q2 2022 and this is also the quarter where the current government took office.
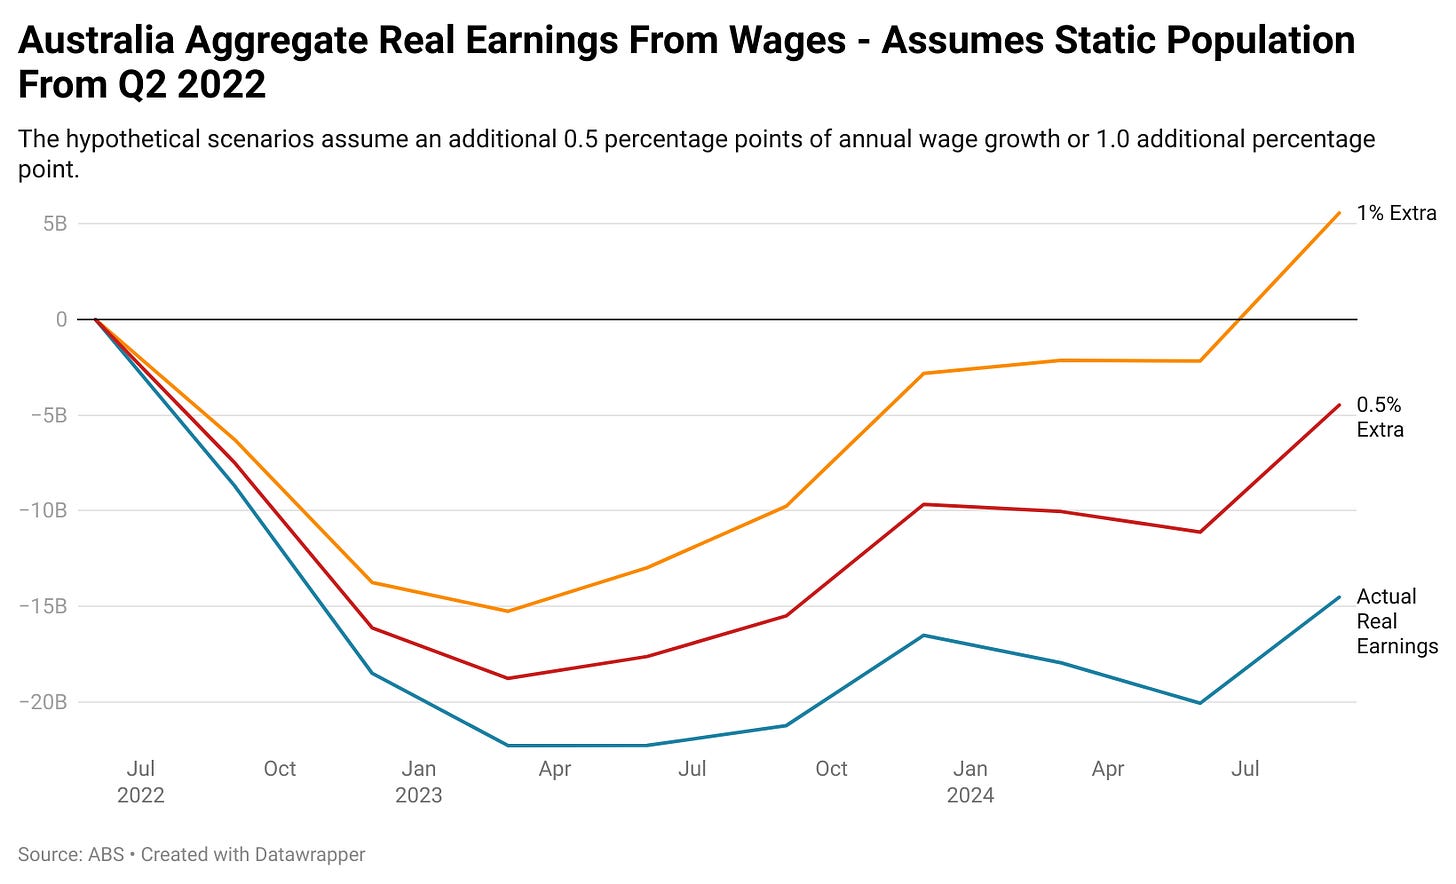
If we assume a stable workforce size, in nominal terms wages growth has added $85.5 billion a year to household coffers in gross terms since June 2022. After adjusting for inflation, wages have taken $14.5 billion from household coffers in the last 9 quarters.
By adding an extra 0.5 percentage points in wages growth per year, total real wages compared with June 2022 would be down $4.5 billion. If we up that to an extra 1.0 percentage point in wages growth per year, the figure rises to a positive contribution of $5.6 billion per year.
Its worth noting that all of the inflation adjusted figures are based on the latest ABS numbers, which encompass a heavy artificial fall in inflation due to the impact of government subsidies. Projections from the RBA indicate that headline inflation will accelerate back above its target band once the impact of these subsidies draws to a close.
Meanwhile, in the last 9 quarters the working age population has grown by 1.35 million people. Based on the level of working age population growth seen during the months of zero net migration, I estimate that around 80% of that increase has stemmed from net overseas migration.
Currently total annualized household consumption per capita (working age individuals) is running at $54,400 per year in 2024 dollars, down from $56,000 in December 2022 and $54,800 in September 2018.
This figure may seem high, but the estimate for household consumption spending for the average international student is significantly higher at roughly $78,000 per year in 2023, as concluded by Dr Cameron Murray of Fresh Economic Thinking. Whether that is the case in reality is another matter as Dr Murray concluded in the linked article, but for the sake of argument the $54,400 figure seems within the realm of the ballpark.
At an average rate of per capita consumption, the growth in the working age population since June 2022 has added $73.3 billion in real consumer spending into the economy.
Apples And Oranges
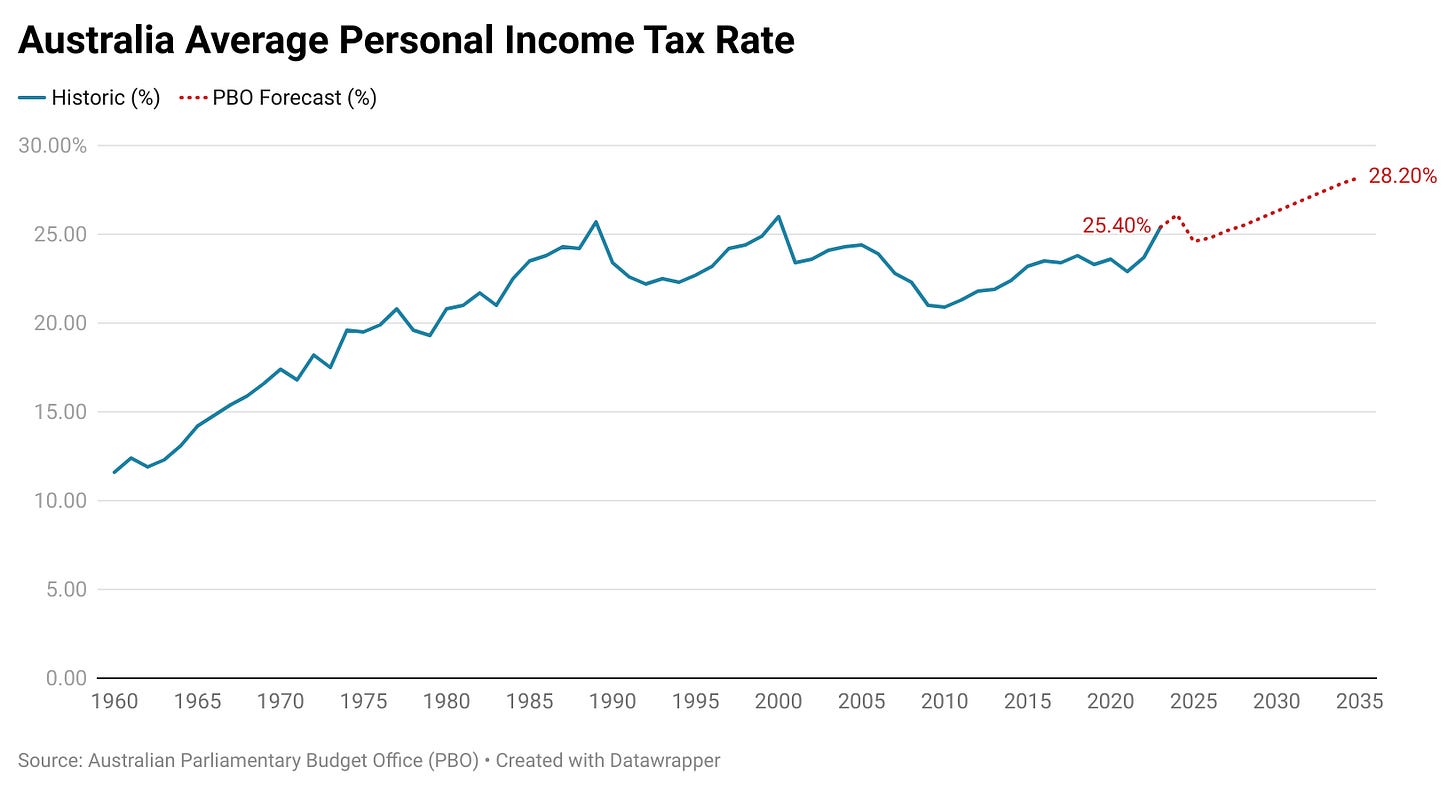
Part of the issue with contrasting wages growth with actual consumer spending is that wages are subject to external factors which impact its effect on aggregate demand, such as income taxes.
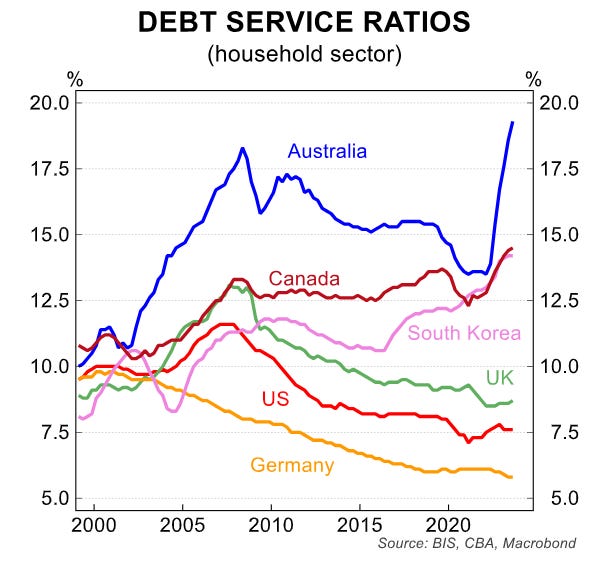
There is also the impact of debt servicing and individuals investing their income to consider, further reducing the amount of income from wages growth that actually ends up increasing aggregate consumer spending.
If we once again assume the working age population remained stable with where it was in Q2 2022, total household consumption spending would have fallen by $33.2 billion per year in inflation adjusted terms, a figure that is significantly greater than the impact of lost real wages purchasing power.
Netting It Out
If we boil it down to a single number, total annualized growth in consumer spending since June 2022 is roughly $40.2 billion, assuming real per capita household spending remained roughly on par with where it was Q2.
This is illustrative of what RBA Governor Michele Bullock was getting at in her recent press conference, noting that while demand had fallen significantly in per capita terms, overall aggregate demand remains too hot for the Reserve Bank’s comfort.
While higher wages growth would have placed additional upward pressure on inflation, when put into perspective with other factors the additional roughly $10 billion or $20 billion a year in additional flows to households that would have resulted from wages growth being 0.5ppt or 1.0ppt higher is somewhat removed from those having the greatest impact.
After accounting for the impact of income taxes, as well as sizable proportion of the additional income being saved (as the Stage 3 tax cuts are being now), used to pay down debt or otherwise invested, the amount of cash from wages being spent into the economy would be lower in real terms today than it was in June 2022, assuming a static population size.
Ultimately, wages have not been the defining influence on inflationary pressures they once were during this economic cycle and given the current settings of the economy that is unlikely to change. The much more likely scenario is that households spend the next decade or more, attempting to claw back the purchasing power their wages have lost since the onset of the pandemic.
— If you would like to help support my work by making a one off contribution that would be much appreciated, you can do so via Paypal here or via Buy me a coffee.
If you would like to support my work on an ongoing basis, you can do so by subscribing to my paid Substack


The one million plus suppressed wage demands, and was why they did it.