
Sydney Auction Market Collapses To Pandemic Lows
The history and real world implications charted


In the broader world of real estate transactions, Australia is unique in that such a large proportion of homes are sold under an auctioneers hammer.
For decades outcomes in the nation’s auction markets have made headlines in the media, with everything from rising or falling clearance rates to particularly expensive properties being sold generating interest from their readership.
Now a truly historic event is unfolding in Sydney’s auction market in particular, clearance rates have recently absolutely collapsed to the lowest level since the absolute height of the pandemic according to figures from SQM Research, which is widely considered the gold standard for auction clearance data.
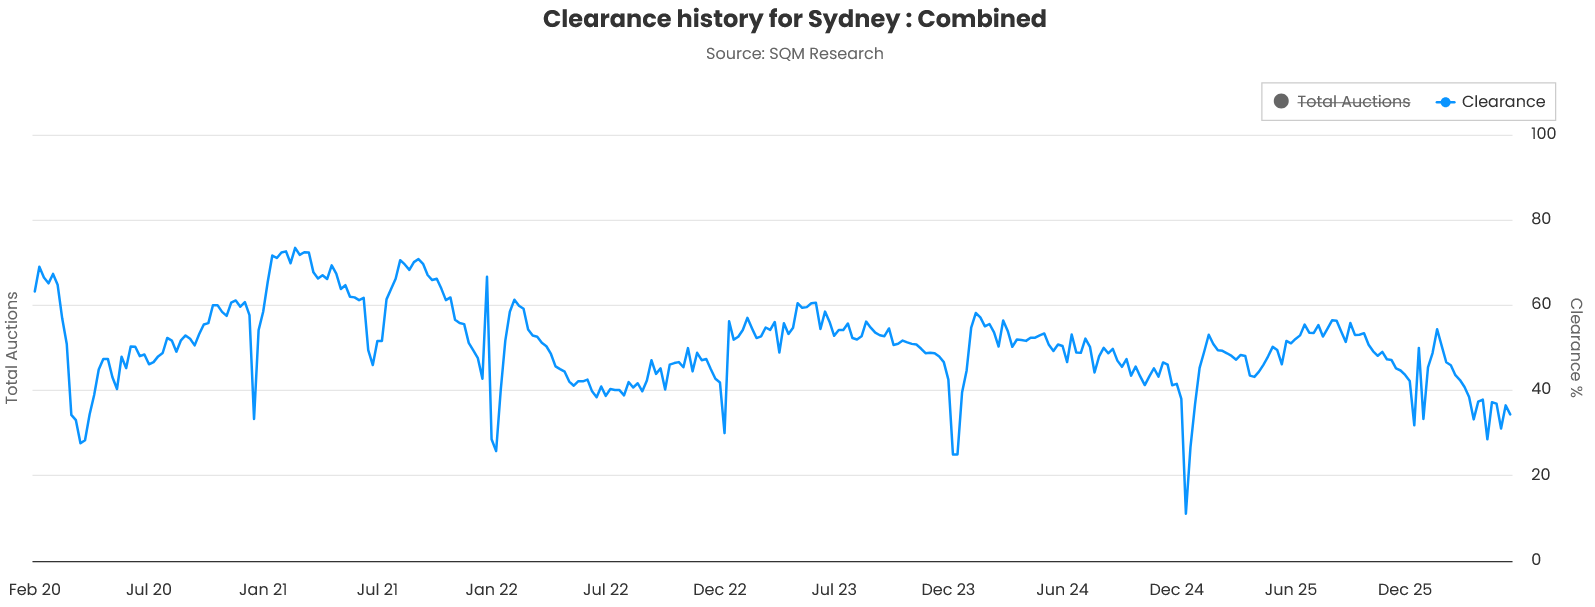
Source: SQM Research
Today we will be examining the following:
Falls in auction clearance rates in the present, versus recent trends and a comparison with the same time of year in prior years.
Historic clearance rates during Sydney’s last major period of falling home prices between February 2022 and January 2023.
Charting historic clearance performance against price growth during that period.
What the trajectory of prices looks like in the present.
Factors that came to Sydney’s aid during previous price falls
Comparing size of previous price falls with other major markets
Clearance Rates In The Now, Contrasted
Since the last result unimpacted by the war in the Middle East, clearance rates have fallen by 12.2 percentage points to a figure of 34.4% in last weekend’s data.
Of that, 2.5 percentage points has come since the Albanese government released its budget on the 12th of May.
While this is up from the recent low a fortnight ago of 31.1%, this is still the second weakest result in the history of SQM’s data set (ex-public holidays and the Christmas season) excluding those impacted by the pandemic.
As you can see from the chart below, things have swiftly gone from bad to worse for Sydney’s auction market, with clearance rates falling by 20.0 percentage points since the seasonal high in the week of the 8th of February.
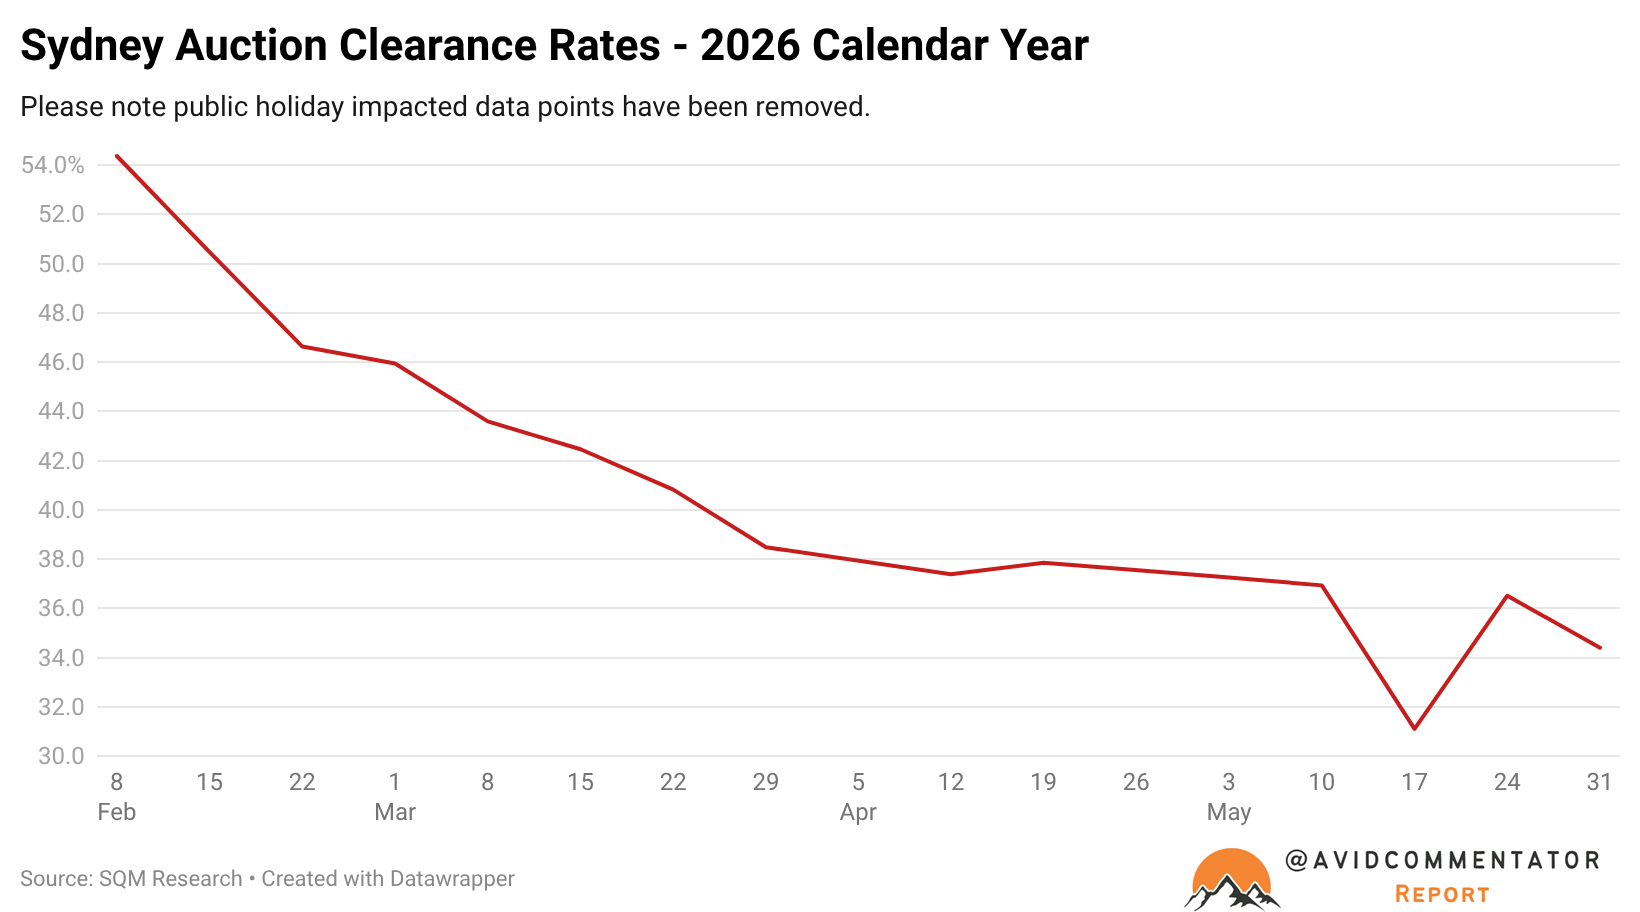
When compared with the path taken by Sydney’s clearance rates during this time of year in 2024 and 2025, the true scale of the historic deterioration unfolding begins to become apparent.
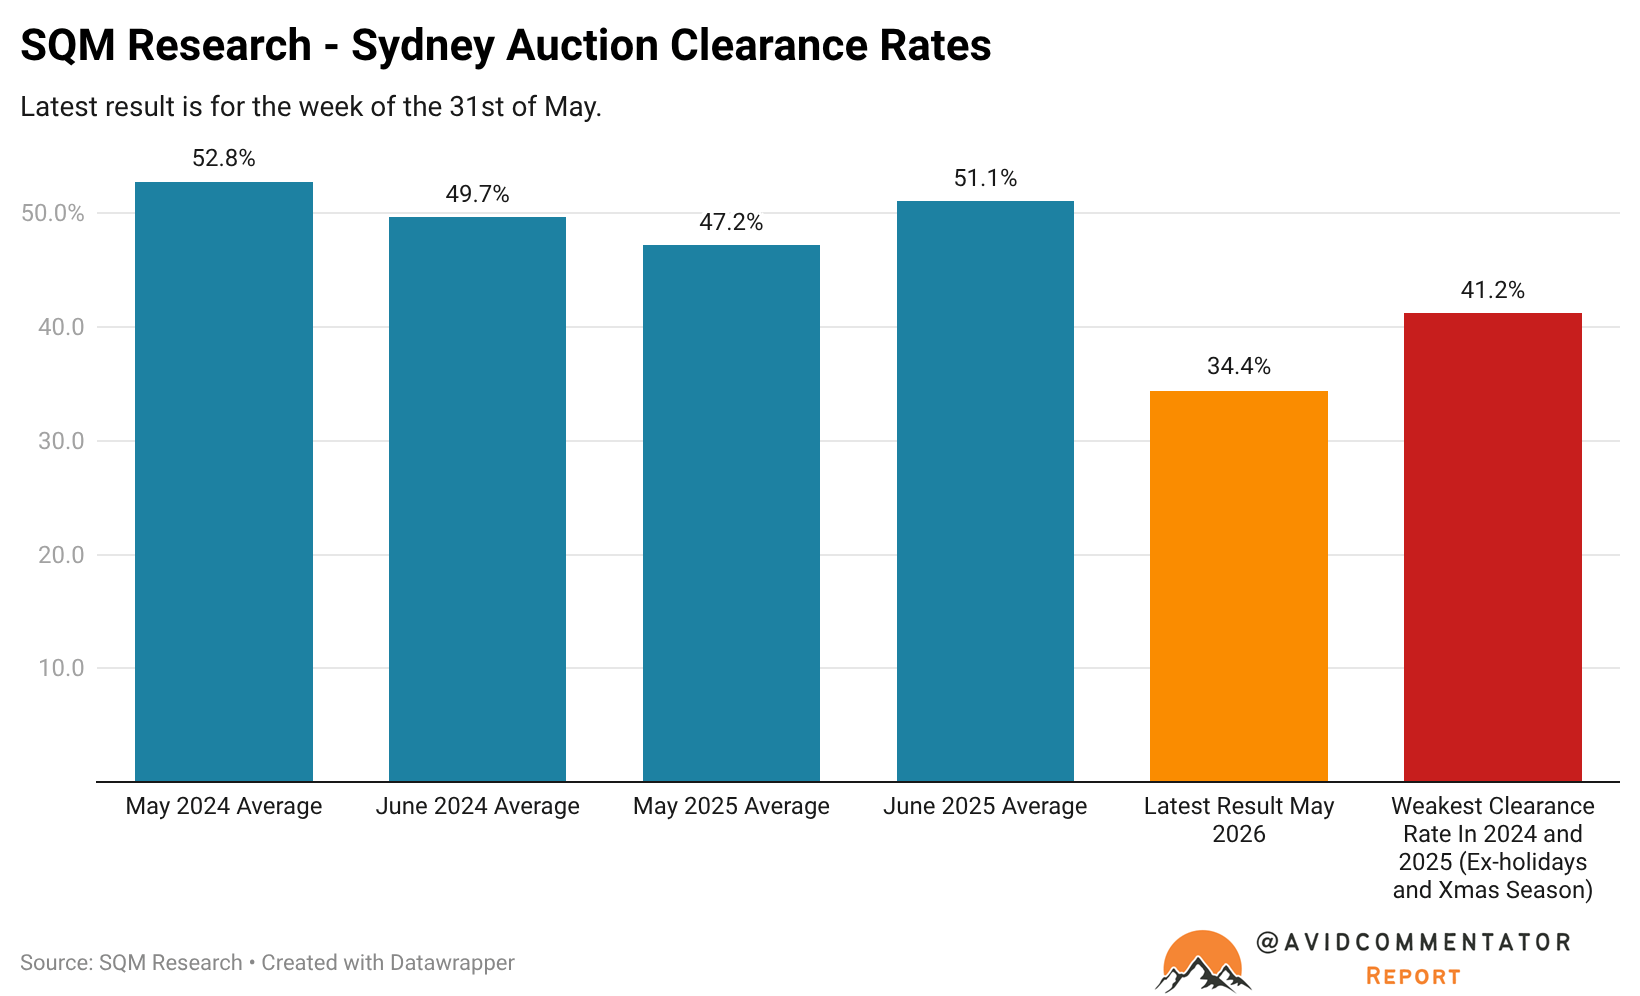
The averages for this time year are as follows (excludes the impact of public holiday impacted results):
May 2024 - 52.8%
June 2024 - 49.7%
May 2025 - 47.2%
June 2025 - 51.1%
The most recent results has the clearance rate of 34.4%, 18.4 percentage points below the average for May 2024 and 12.8 below the average for May 2025.
Auction Clearance Rates Vs Previous Price Falls
Despite recent years being remembered mostly for a largely unending boom in housing prices, there was a now largely forgotten period in which the path of Sydney housing price growth looked like a potential crash.
As the pandemic driven property mania gradually began pass in early 2022, it didn’t take long for housing prices in Sydney to begin to go south.
By mid-February housing prices had peaked and began to fall, with the first full month recording a drop coming in March with prices down by 0.44%.
By July, the path of prices was well and truly in housing crash territory, with prices down by 2.2% month on month in July and down by 2.3% in August.
During this period of price falls Sydney auction clearance rates averaged 46.4%, 12.0 percentage points higher than the most recent data point.
The weakest data point of that era came in June 2022, with a 38.4%, 6.0 percentage points below the most recent data point.
If we were to use clearance rates alone as our indicator, the Sydney market is in a weaker position today than it was at the height of the previous price correction.
Below is a chart revealing the strong correlation between the trend in auction clearance rates and housing prices during that time period.
Keep reading with a 7-day free trial
Subscribe to Burnout Economics to keep reading this post and get 7 days of free access to the full post archives.