
The Rise Of One Nation & Problems With The Budget
From polling to the fine details of the budget papers

With data from six of the major pollsters now under our belt, we can begin to assess how the budget was received through the lens of where Australians are dedicating their primary votes.
Looking at the available data so far, the news for the Albanese government is not fantastic.
On an average basis across polling from Roy Morgan, Newspoll, Resolve, Freshwater, YouGov and DemosAU (which is what is available at the time of this article being written), Labor’s primary vote is down by an average of 1.5 percentage points.
At one end of the spectrum, Resolve and Freshwater both see Labor’s primary vote down by 3 percentage points compared with their last pre-budget polls.
At the other, Newspoll and DemosAU see Labor’s primary vote flat compared with their most recent readings, although it is worth noting that DemosAU sees Labor’s share of the vote at a highly depressed 26%.
This helped to drive a first in Australian federal politics, a major pollster seeing One Nation with a higher primary vote than Labor (28% vs 26%), excluding SMS polls.
On the other side of the coin the budget was at the average a favourable one for One Nation, with their share of the primary vote up by an average of 1.92 percentage points.
For the Coalition, the news was less favourable but still marginally positive, with their share of the primary vote up an average of 0.5 percentage points.
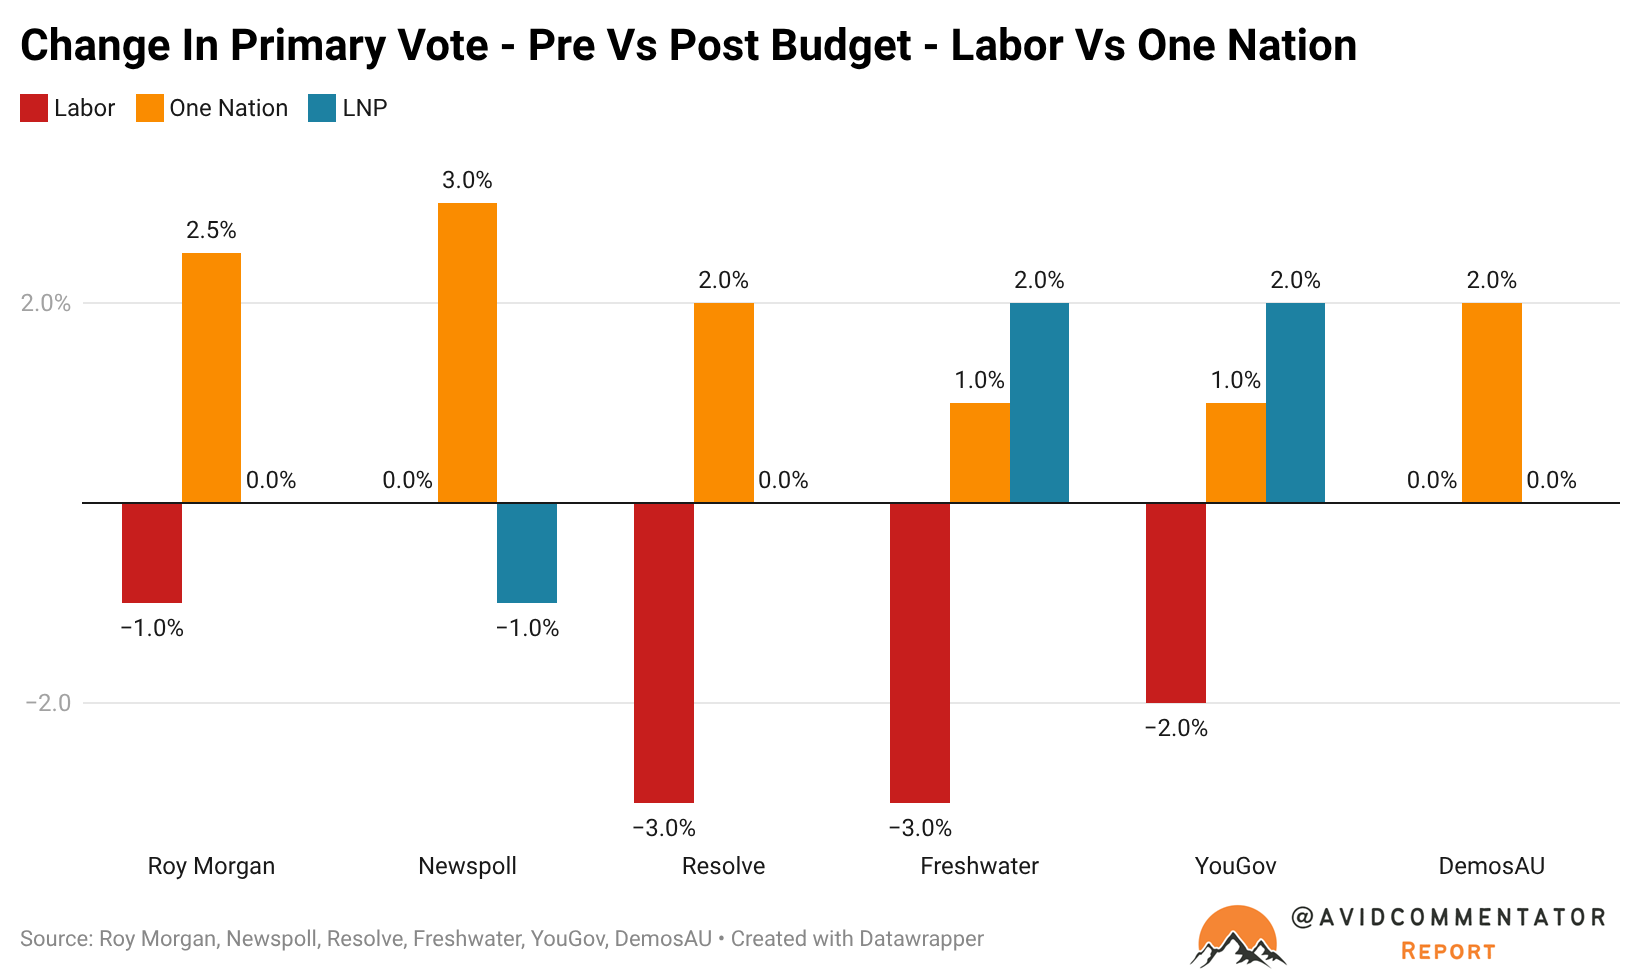
Each pollster assessed today saw an increase in One Nation’s share of the vote, from Freshwater and YouGov which saw a 1 percentage point increase to Newspoll which saw a 3 percentage point increase.
While these are naturally the most preliminary of indicators, at the average they paint a picture of a budget that has at best fallen flat with the electorate.
In the weeks and months ahead as the government defends its decisions and priorities as it attempts to legislate its budget, a more complete picture will emerge on how it has impacted the balance of federal political landscape.
Views On The Budget In A Vacuum
In terms of the budget itself, polls suggest it was poorly received by the electorate.
According to an analysis from polling expert Kevin Bonham, it was the second worst received budget for its impact on the economy “by some margin”, with only the 1993 performing worse.
In terms of the impact on voters personally, it was third worst received budget on record, again falling behind the 1993 federal budget and also the Abbott government’s disastrous 2014 efforts.
Polling data from Freshwater has echoed these results, with only 22% holding the view that it would improve the economy, compared with 46% who believed it would worsen things.
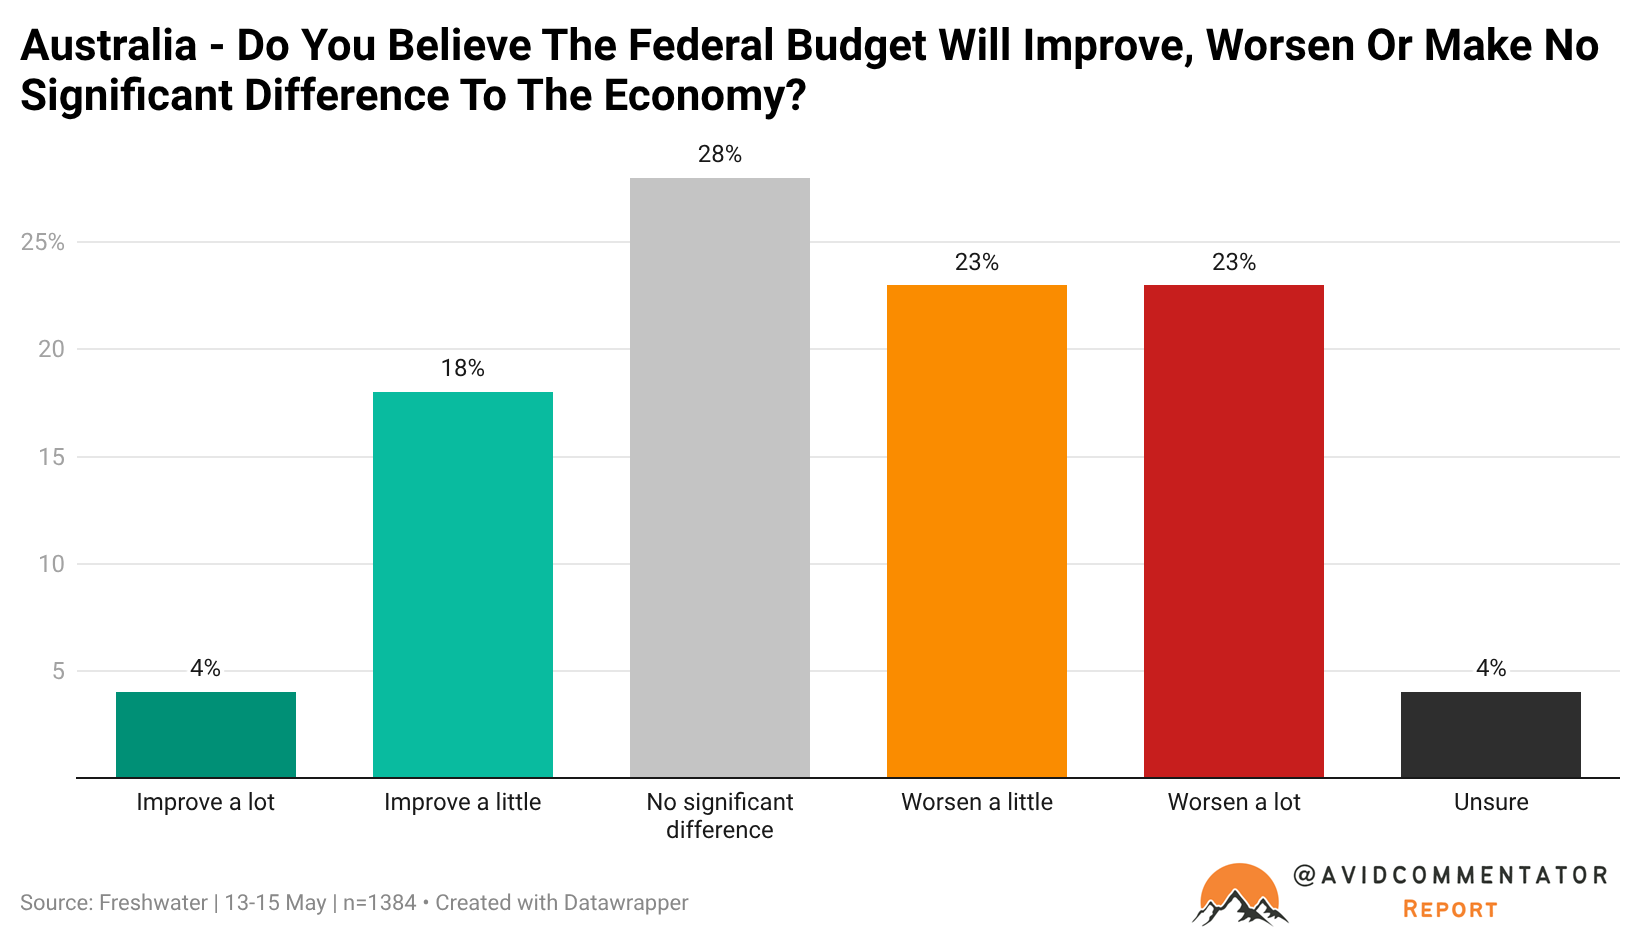
This is a rather interesting set of results, as the level of realized opposition to the various proposed changes as individual issues is generally polling in the 20s and low 30s, albeit with an extremely high level of voters who are neutral or unsure.
Across the various polls a large majority of Australians with an opinion either way seem to instinctively believe that this budget is bad for the economy and bad for households.
For what reason we can only speculate, but it is my suspicion that they are correct and the impact of the budget will be far greater than the level of additional revenue in the forward estimates suggests.
This brings us to one of the biggest issues with the budget.
A Whole Lot Of Anticipated Take, Not Much Give
In the years of debate over the issue of negative gearing and the capital gains tax discount, one of the proposed ways of making their removal more politically palatable was by accompanying them with associated income tax cuts.
But as the budget papers reveal, this is not really a viable strategy.
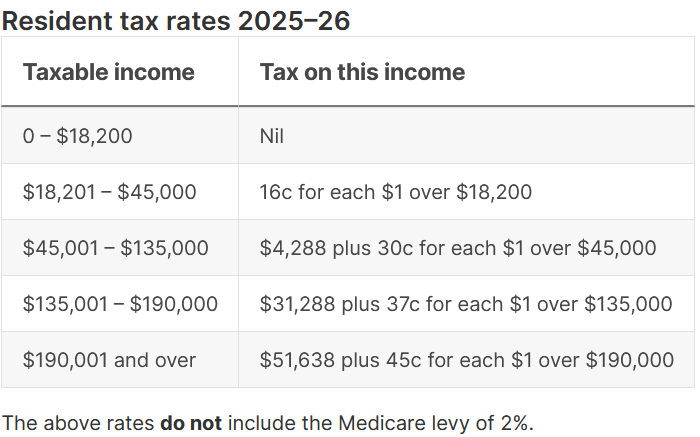
To give tax cuts in the future the best possible chance of success, we will be looking at the budget estimates for 2029-30.
In 2029-30, the changes to negative gearing and the capital gains tax discount will produce $2.28 billion worth of additional revenue.
If we plug those numbers into the income tax take, it would roughly provide scope to cut the 19% bracket (for earners making $18,001 to $45,000) to 18%.
This would save the median full time earner around $270 per year.
If we leave aside the politics for a moment and look purely at the numbers, the issue is grandfathering.
By pursuing a policy of grandfathering with the negative gearing and capital gains tax discount changes, the government has effectively been left with a budget that tells you it will take in the future, but provides almost zero real scope to give to offset that any time soon and little scope before the end of the decade.
But what if we add the minimum 30% tax on discretionary trust distributions to the mix, adding an additional $4.47 billion in revenue.
With $6.75 billion per year to play with, we can now almost afford to cut the 19% tax rate to 18.5% and the 32% bracket to 31.5%.
This serves to illustrate that sizable income tax cuts simply aren’t really viable with the extra revenue provided by this budget.
The Other Side Of The Ledger
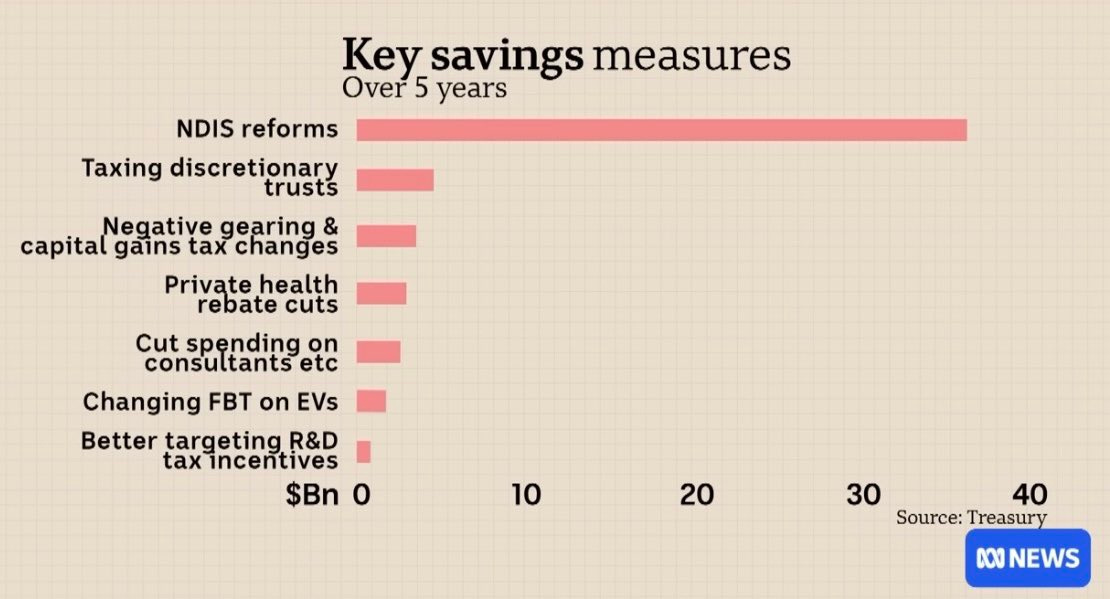
The current issues plaguing the federal budget were recently summed up by a graph shared on ABC News.
It reveals that over the five year forward estimates, the additional tax revenue created by the tax changes targeting discretionary trusts, negative gearing and the capital gains tax discount pale in comparison to the proposed NDIS reforms.
The ABC also recently put together a fascinating analysis on the projected cost of the NDIS over the long term based on the 2015-16 budget, which I have graphed out below in greater detail.
As the analysis reveals, by 2022 the NDIS had already grown to be larger than it was expected to be in 2032.
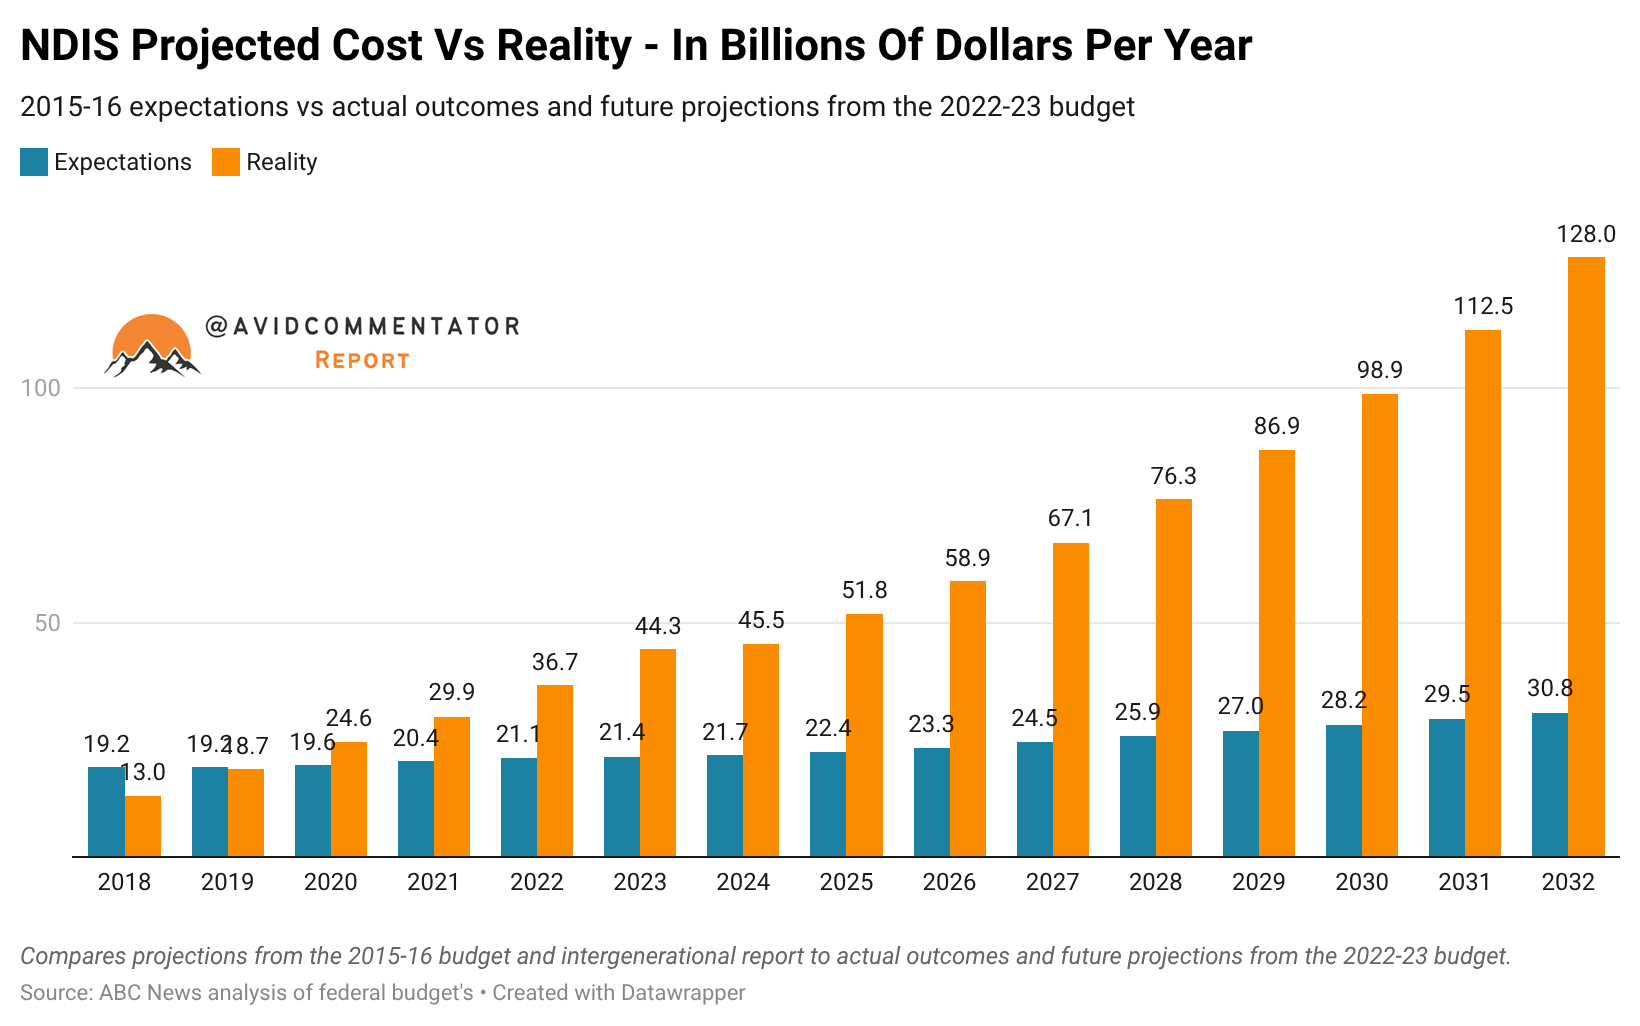
While the recent reduction in growth projected by the federal government and forecast out by the Parliamentary Budget Office (PBO) (Medium Term Budget Outlook) has improved the future trajectory on paper, it still proves revealing of where some of the budget’s major problems lay.
For example, if the NDIS budget continues to grow on the baseline put forward by the PBO, by 2029-30 it will cost approximately $67.2 billion per year, compared with an ABC News projected cost of $28.2 billion.
Or put somewhat differently, the $39 billion blow out in the cost of the NDIS is 5.8x larger than the revenue gained through the changes to negative gearing, capital gains tax and family trusts put together.
The Takeaway
While changes to negative gearing and the capital gains tax as they relate to existing housing were arguably necessary, the other changes have helped to produce a far more broad backlash and level of opposition to the budget.
By having little to give amidst a budget that seemingly looks to take, Jim Chalmers and Anthony Albanese have entered a deeply undesirable set of record books alongside Tony Abbott and Joe Hockey for poorly received budgets as assessed by the decades long history of Newspoll.
Meanwhile, the very nature of grandfathering means that the level of additional revenue the Treasury will generate in the short term is relatively minimal, providing little scope for a carrot to go with the widely perceived stick.
How this budget will end up going down in history books remain an open question, but what is more clear how challenging it is to ease burden on the nation’s wage earners through revenue raising alone, especially when the cost blow outs for big ticket policies such as the NDIS and Snowy Hydro 2.0 have played a major role in removing what scope might have one day existed.
— If you would like to help support my work by making a one off donation that would be much appreciated, you can do so via Paypal here or via Buy me a coffee.

If you would like to support my work on an ongoing basis, you can do so by subscribing to my Substack or via Paypal here
Thank you for your readership.